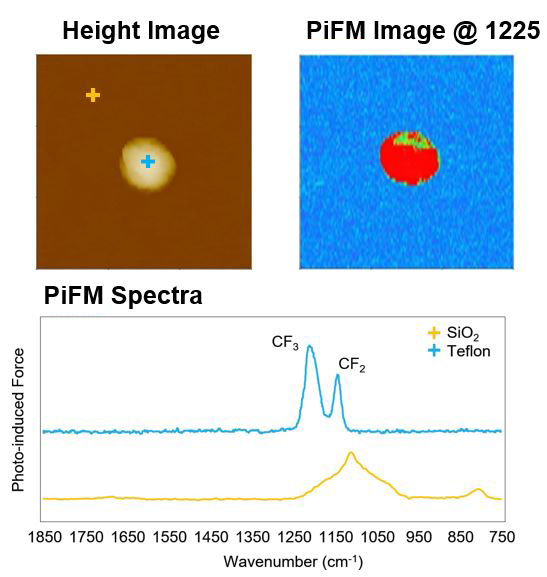
This slide shows the analysis of a Teflon defect on a SiO₂ substrate.
The AFM topography image reveals the defect location and structure on the surface.
The PiFM chemical image then highlights the contrast between the Teflon region and the surrounding SiO₂.
The IR spectra confirm the chemical identity by showing characteristic absorption peaks of Teflon that are absent in the SiO₂ background.
Together, these results demonstrate how PiFM correlates morphology with chemical specificity at the nanoscale.
Scanning Conditions
- System: AFM-IR
- Scan Mode: PiFM (Channel: Z Height, PiFM Amplitude)
- Scan Rate: 0.1 Hz
- Scan Size: 300 µm × 300 µm
- Pixel Size: 512 × 64 pixels
Related Contents

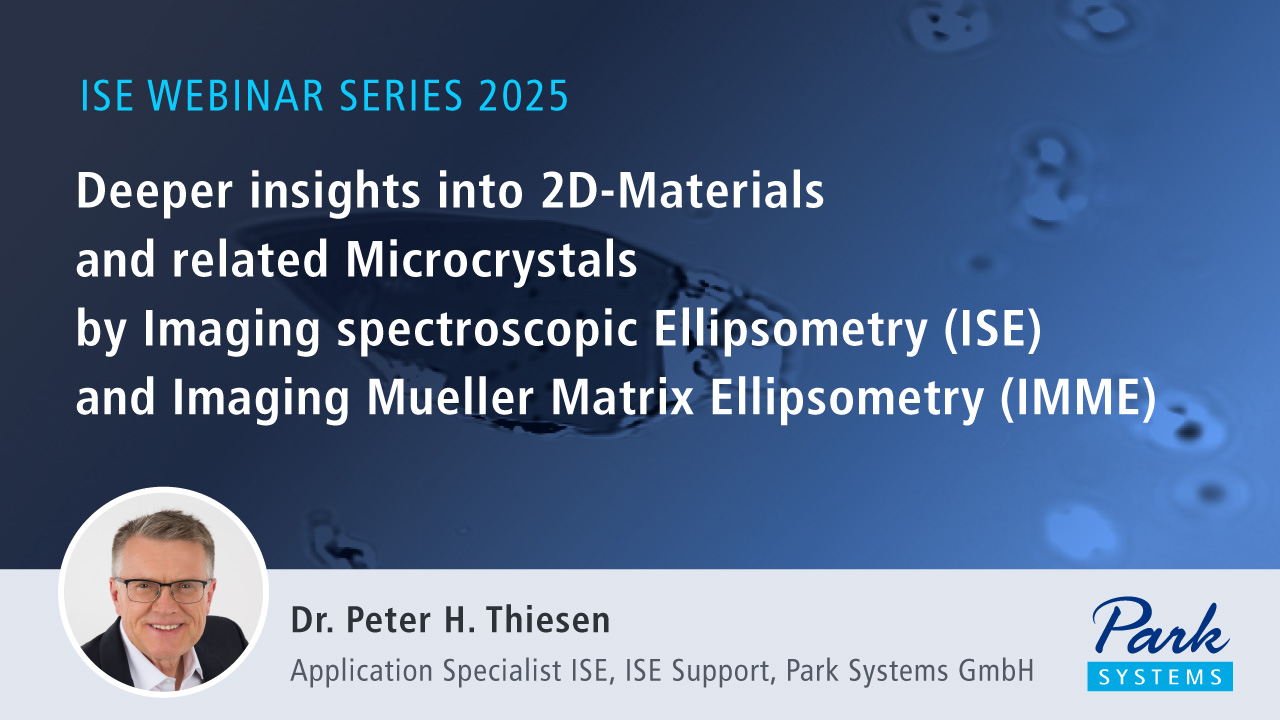
Deeper insights into 2D-Materials and related Microcrystals by Imaging Spectroscopic Ellipsometry (ISE) and Imaging Mueller Matrix Ellipsometry (IMME)

Imaging Müller Matrix Ellipsometry for Quantifying Dielectric Tensors of Molecular Microcrystals as well as Analyzing Engineered Microstructures


