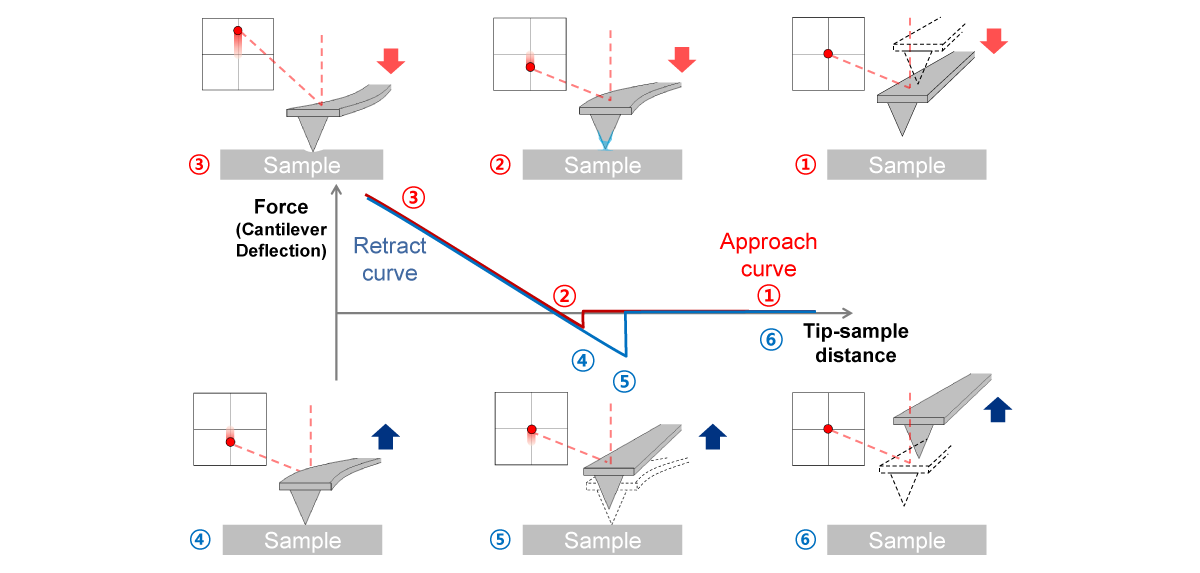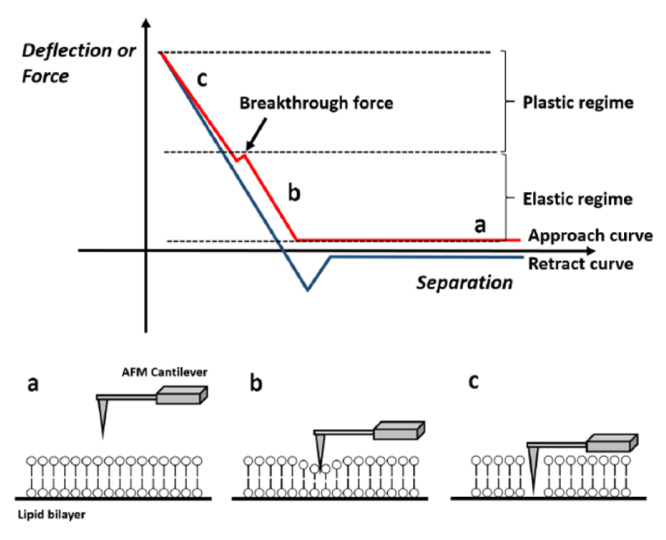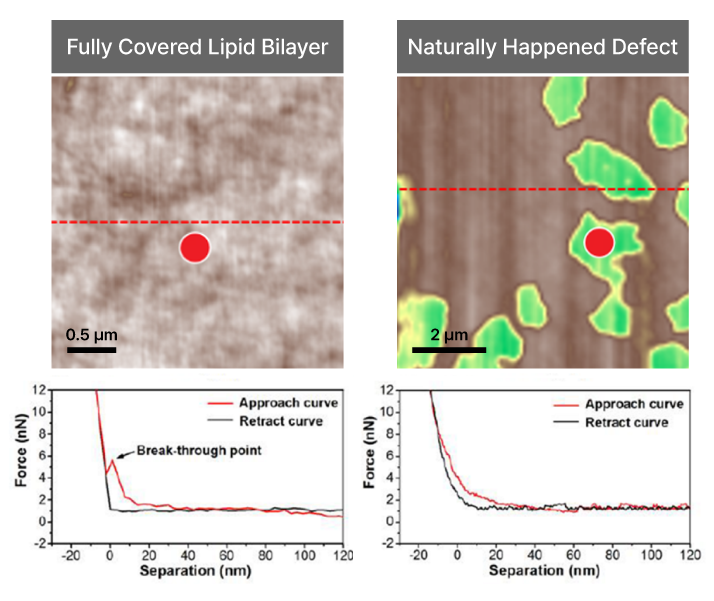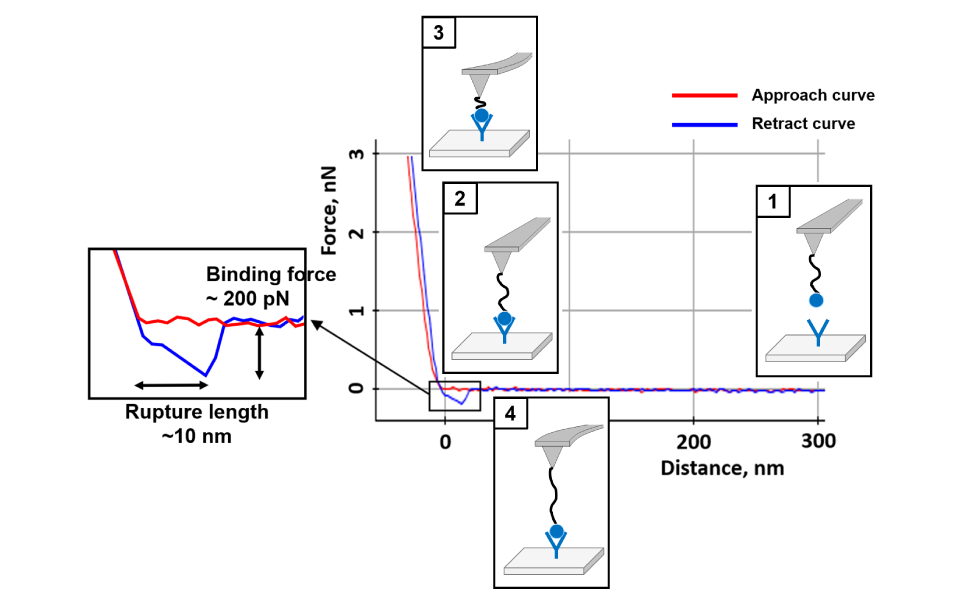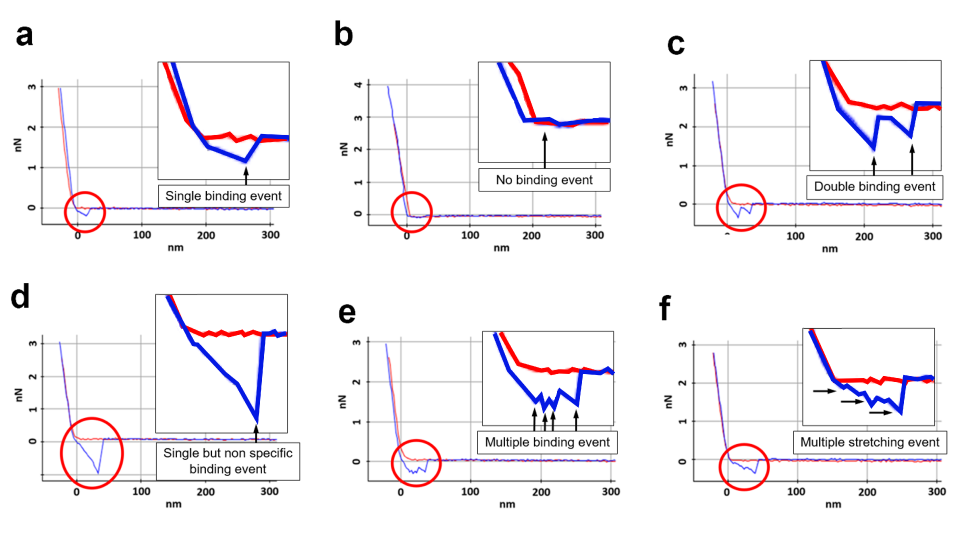
Force-distance Spectroscopy
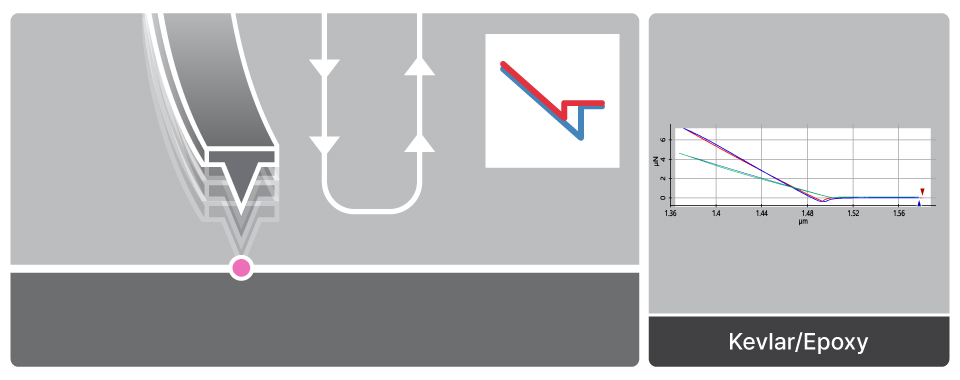
F/d Spectroscopy
Mechanical property analysis by recording cantilever deflection relative to controlled tip–sample distance during approach and retraction cycles