Electrochemical Microscopy (EC-AFM)
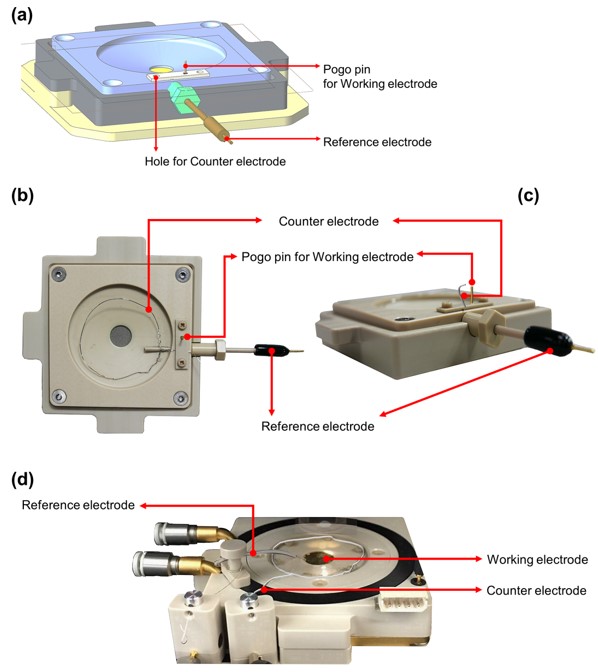
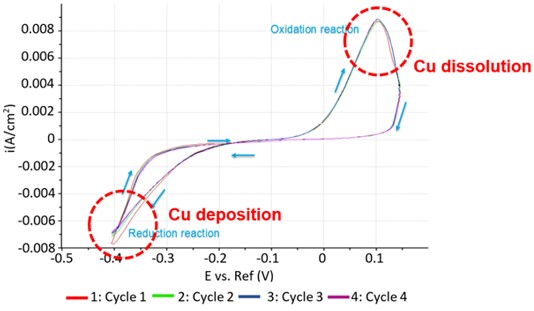
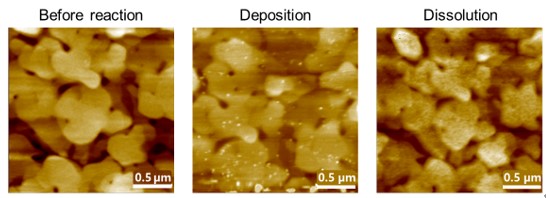
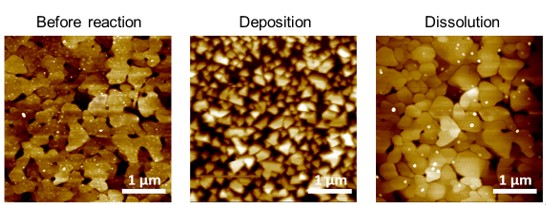
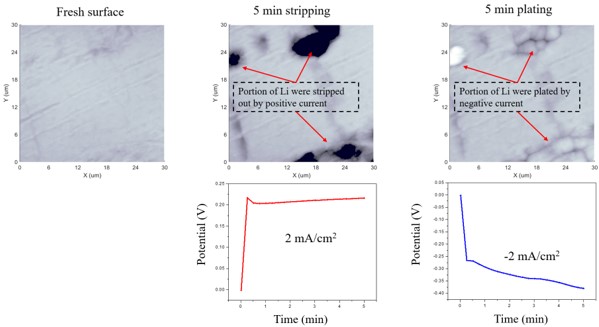
In EC-AFM, STM the nanoscale structures of electrochemical reactions on the electrode surface can be observed. Users typically perform voltammetry and corrosion experiments using an electrochemistry cell and a choice of potentiostat/galvanostat depending on the electrochemical application of interest.
x