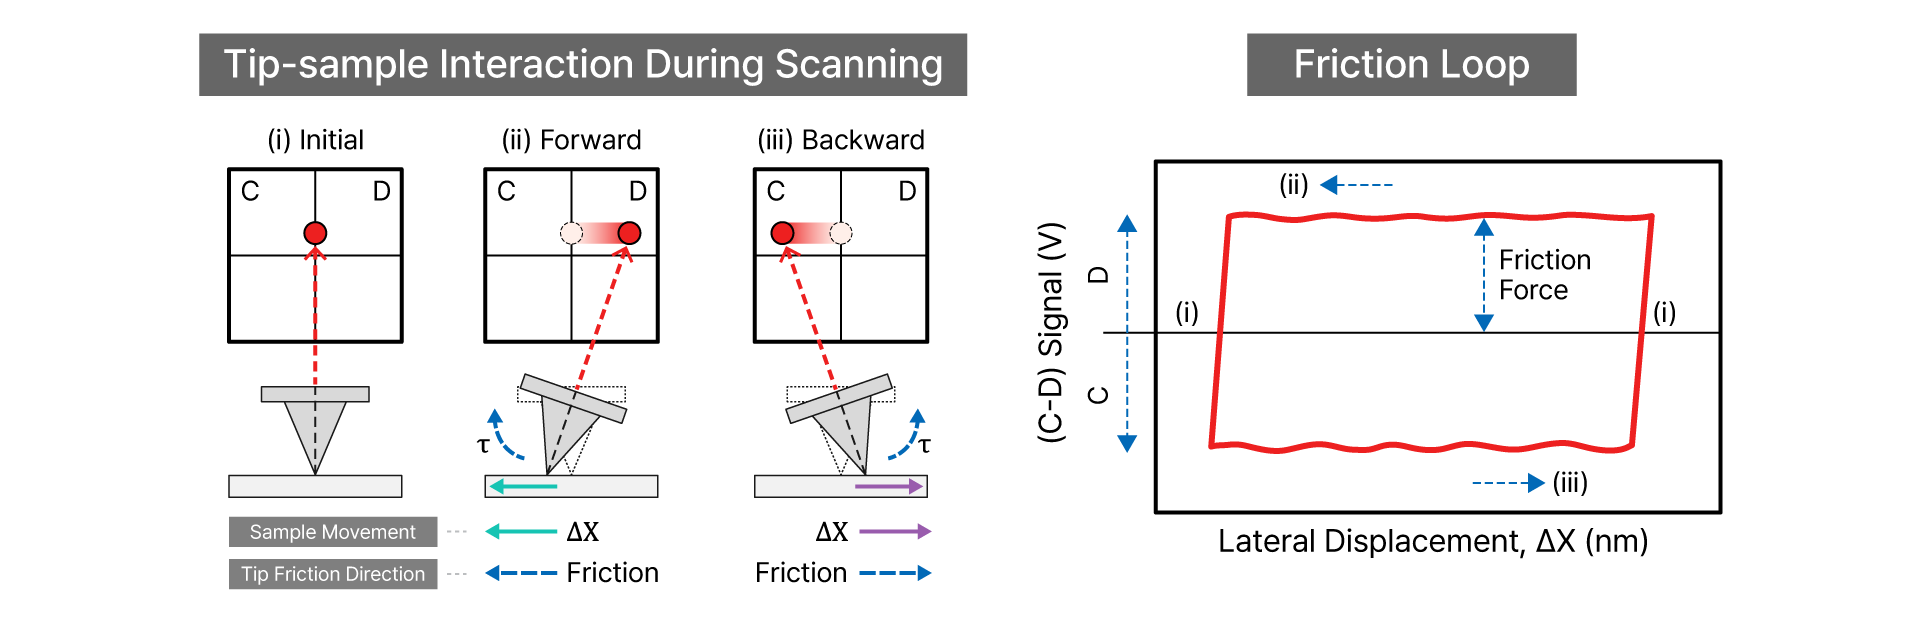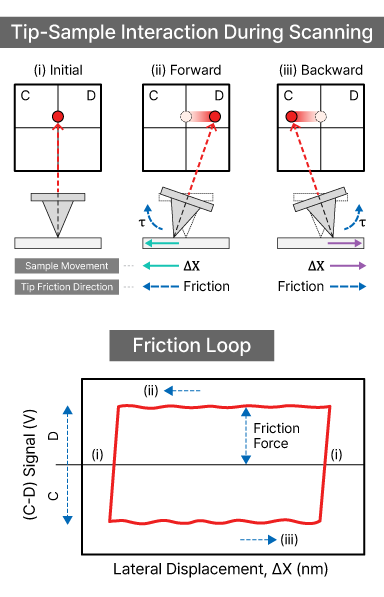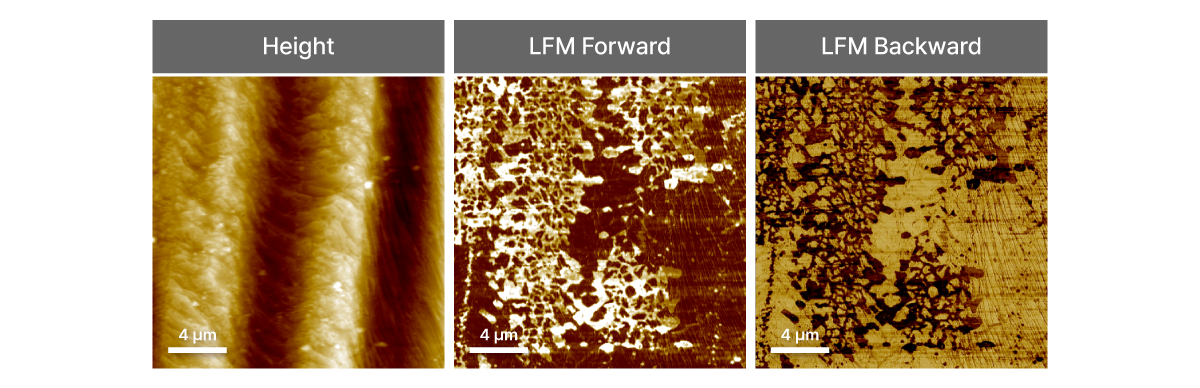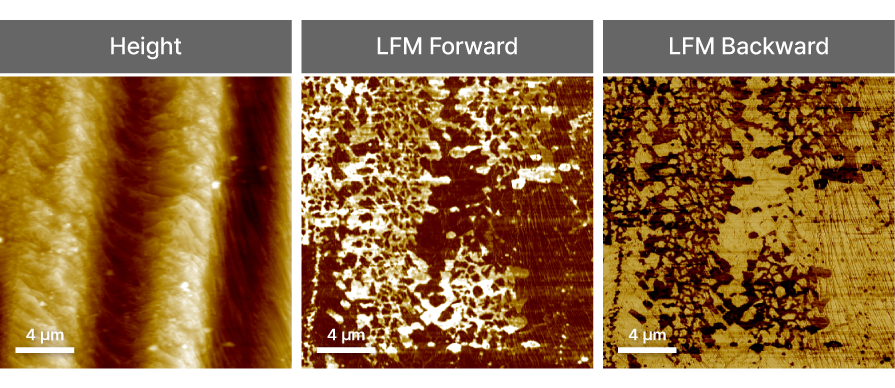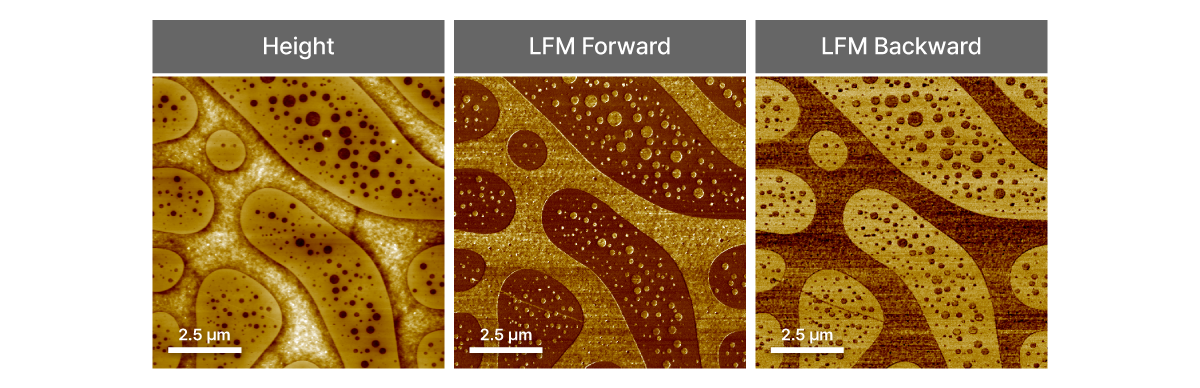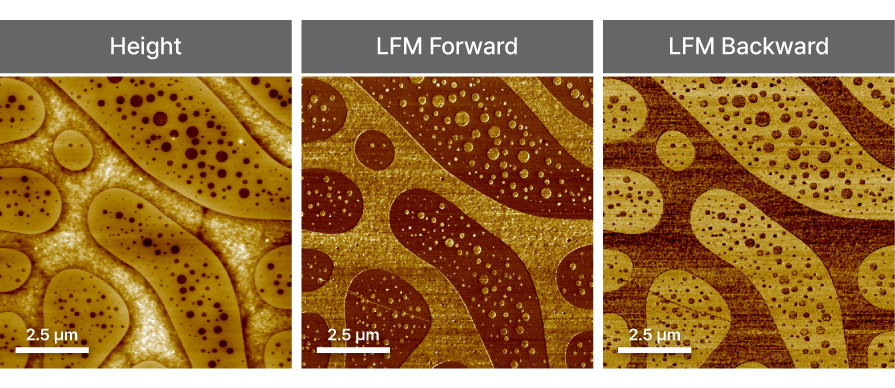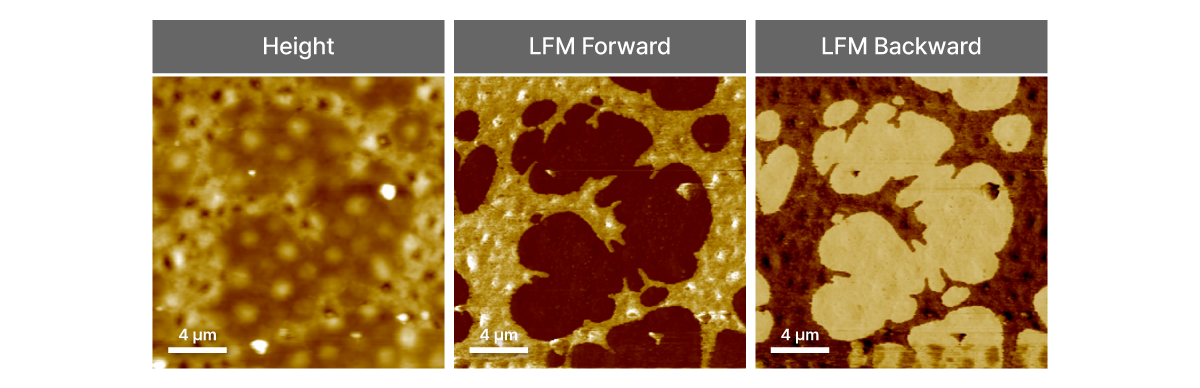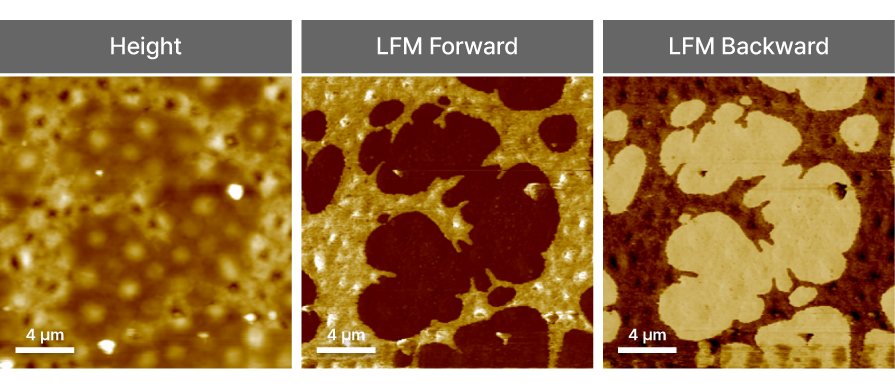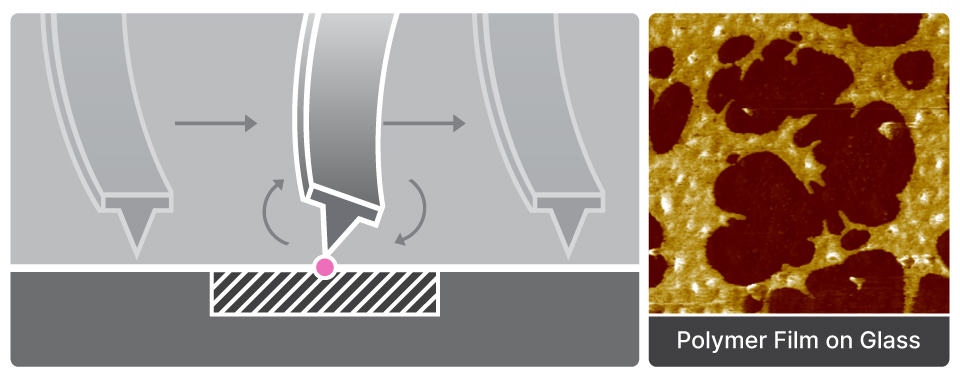
Lateral Force Microscopy
LFM
Analyzing friction and slip behavior through mapping lateral forces across the surface