Abstract
Operando Imaging ellipsometry enables the microscopic real time imaging of the electrode material in a working cell with a lateral resolution down to 1 μm while the cell is charged/discharged or is changed under other external influences. Imaging ellipsometry in more general, combines optical microscopy and ellipsometry for spatially resolved layer-thickness and refractive index measurements of micro-structured thin-films and substrates. It is an all-optical, non-destructive measurement technique, based on the sample’s interaction with polarized light. Imaging Spectroscopic Ellipsometry (ISE) is highly sensitive to single- and multi-layer ultrathin films, ranging from mono-atomic or monomolecular layers (sub-nm regime) up to thicknesses of several microns. The technique has been used to characterize the optical properties of graphene, to localize flakes and for atomic layer resolved Imaging of 2D Materials with microscopic resolution.
Introduction
Graphite is already a very good material to store ions; the possibility to exfoliate graphite in graphene sheets, functionalize them and then reassemble them in less compact structures gives fantastic opportunities to create new materials for battery applications [1]. One motivation for designing novel anode material for sodium ion battery is, among other things, the lower price and better availability of sodium. One technical challenge is that a direct intercalation of the larger sodium ions into untreated graphite does not take place. Sun et.
al. provided a new idea using pillared artificial graphite nanostructures based on “Janus” graphene to address this issue [2].
The reversible intercalation of sodium ions into Janus graphene was investigated. Microscopic Maps of Delta and Psi were recorded to determine the changes in Janus graphene during charge/discharge cycles [2].
Experimental Materials
Asymmetric functionalized graphene (Janus graphene) was transferred in a commercial electrochemical cell (EC-CELL). The cell was assembled in inert gas atmosphere, using a glove box [2].
For sodium ion battery test setup the Janus graphene stacks deposited on a glass disc was the working electrode, glass fiber as separator, and sodium metal as counter electrode for Sodium Ion Batteries (SIB).
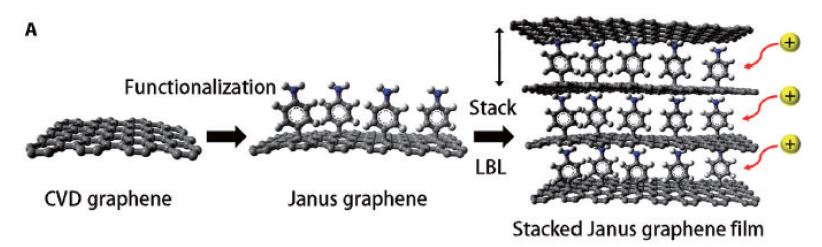
Figure 1. Assymetric functionalization of graphene (Janus graphene) [2]
Methods
To investigate the voltage depending intercalation process of sodium ions into Janus graphene was investigated in spatial and time resolution using electrochemical operando imaging ellipsometry. To avoid the interference of Solid Electrolyte Interphase (SEI) formation and side reaction, which could also cause the variation of thickness and optical parameters of Janus graphene thin film, the new cell was first discharged to 0.05 V versus Na/Na + from open circuit voltage and afterward charge/discharged between 1 and 0.05 V versus Na/Na+, Microscopic Delta and Psi maps were recorded with an EP4 (Park Systems GmbH, Goettingen Germany). The time-depending measurements were performed with a light-emitting diode (LED) at 532 nm. The microscopic maps were recorded with a 20x objective lens at an angle of incidence of 45°.
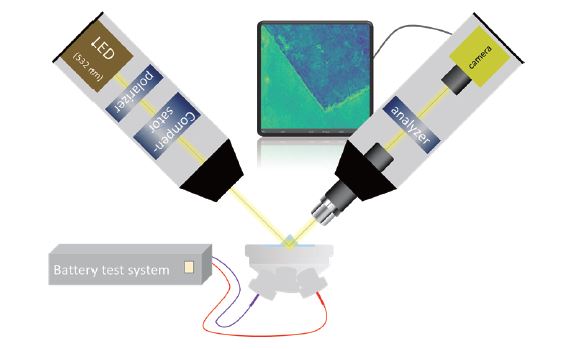
Figure 2. Experimental setup
Results and discussion
The primary result of a time depending measurements is a stack of microscopic Delta and Psi maps. With the “EP4_Data Studio” software numerical data can be extracted post measurmently for free defined regions of interest (ROI). This method enables displaying the average values of Delta and Psi for the complete Janus graphene flake (Figure 3a) versus time. ISE enable the comparison of different sub structures regarding the local activity. Significantly smaller ROIs can be used for a more detailed view. (figure 3b).
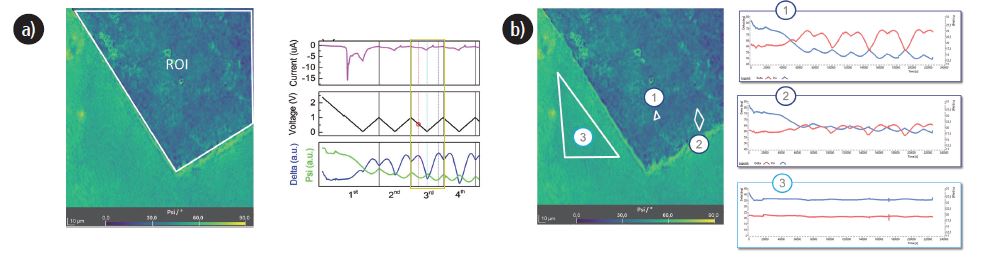
Figure 3. Ellipsometric angles (Delta and Psi) for a region of interest of the size of the complete flake (a) and on areas (1,2-b)of different activity in comparison with the area beside the graphene flake (3-b).
For a better visualization of local activity, referenced maps are very helpful. As an example, the delta map of uncharged Janus graphene was substracted from Delta maps of charged Janus Graphene at different voltage situations (figure 4).
By using referenced Delta maps the effect of charging and discharging reveals for a sample based only on 8 layers of graphene. The comparison of the recorded changes in Delta with simulated data shows that a statement about the changing activity with the number of charge cycles is also possible for such thin samples.
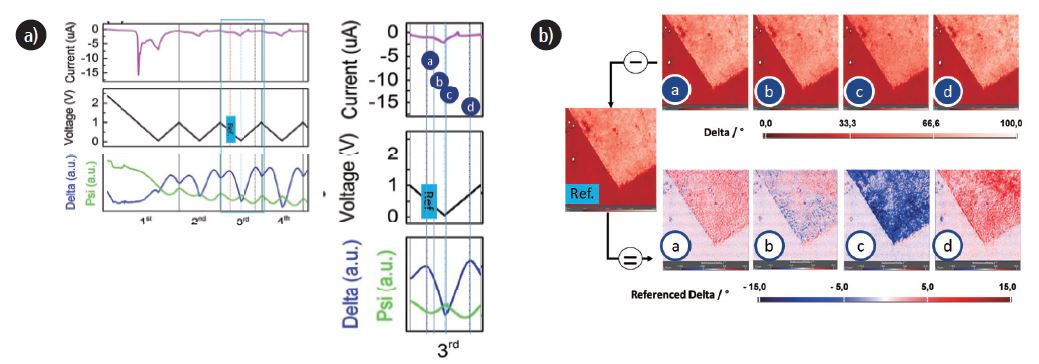
Figure 4. Assignment of voltage, current and cycle to the delta maps of points a,b,c,d and the reference were recorded (a), as well as the microscopic Delta maps and Referenced Delta maps (b).
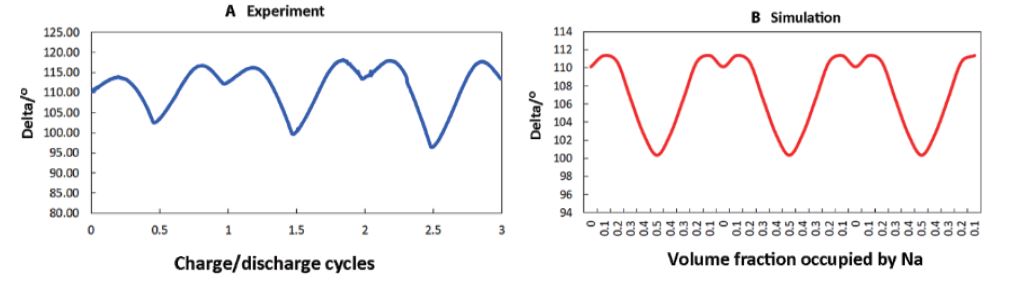
Figure 5. Simulation and experimental data for charging / discharging of a 8 layer Janus graphene stack.
However, such statements would have to be based on a stable statistical framework through a large number of measurements. In addition to the time-dependent measurements, spectroscopic studies on battery materials have also been reported in the literature [4].
The combination of both methods would be very promising to obtain more detailed models about the intercalation of cations into Janus graphene in particular and the voltage depending changes in battery materials in general.
Conclusion
Operando Imaging Ellipsometry is a unique, highly sensitive technology to characterize changes in the optical properties and/or the layer thickness depending on voltage and time.
The region of interest (ROI) base extraction of Delta and Psi-data versus time offers the opportunity to compare different areas of the sample. To compare the samples on a microscopic scale, microscopic maps are the methods of choice.
Reference
[1] Sun, Yue; Sun, Jinhua; Sanchez, Jaime S.; Xia, Zhenyuan; Xiao, Linhong; Chen, Ruiqi; Palermo, Vincenzo (2023) Surface chemistry and structure manipulation of graphene-related materials to address the challenges of electrochemical energy storage. Chem. Commun. 59, 2571-2583
[2] Sun, Jinhua; Sadd, Matthew; Edenborg, Philip; Grönbeck, Hendrik; Thiesen, Peter H.; Xia, Zhenyuan; Quintano, Vanesa; Matic, Alexandar; Palermo, Vincenzo (2021) Real-time imaging of Na+ reversible intercalation in “Janus” graphene stacks for battery applications. Science Advances, 7, eabf0812
[3] Thiesen, Peter H. (2023) Characterization of 2D materials by imaging spectroscopic ellipsometry (ISE). NANOscientific, 24, 9-12
[4] Katzenmaier, Leon; Carstensen, Leif; Schaper Simon J.; Müller-Buschbaum, Peter; Bandarenka, Aliaksandr S. (2021) Characterization and Quantification of Depletion and Accumulation Layers in Solid-State Li+-Conducting Electrolytes Using In Situ Spectroscopic Ellipsometry. Adv. Mater. 33, 2100585.
Application
Related Modes
Related Contents
Spectroscopic Imaging Ellipsometry at Cryogenic Temperatures Applied to Atomically Thin Crystals