Abstract
Piezoresponse force microscopy (PFM) enables nanoscale measurement of the electromechanical response in ferroelectric and piezoelectric materials. However, implementing more sophisticated PFM variants in an easy-to-use platform has not yet been widely achieved. In this application note, we describe the implementation of artifact-free dual-frequency resonance tracking (DFRT) PFM in Park Systems’ automated FX-series AFM systems to investigate the electromechanical properties of the two-dimensional (2D) material CuInP₂S₆ (CIPS). DFRT-PFM simultaneously tracks two resonance frequencies, enabling enhanced measurement stability, improved sensitivity, and reduced topographic and mechanical crosstalk compared to conventional PFM techniques such as off-resonance PFM (OR-PFM) and contact-resonance PFM (CR-PFM). DFRT-PFM is now a standard feature integrated into all Park Systems FX series AFMs, thanks to the multiple parallel lock-in amplifiers built into the FX electronics. Moreover, the system’s multi-lock-in configuration allows simultaneous acquisition of vertical and lateral signals, supporting comprehensive mapping of complex domain structures. The presented results confirm that DFRT-PFM provides superior signal integrity and domain contrast, highlighting its effectiveness for advanced characterization of ferroelectric materials and demonstrating the advantages of Park Systems' integrated controller architecture.
Introduction
CuInP₂S₆ (CIPS) is a prominent van der Waals ferroelectric semiconductor, extensively studied for its room-temperature switchable polarization and strong piezoelectricity even in few-layer form. Its robust ferroelectricity and scalability make it a high-interest material for next-generation memory devices, sensors, and optoelectronic applications¹,². Precise characterization of ferroelectric domains and domain dynamics in CIPS is critical for understanding and optimizing electrical properties such as polarization switching, piezoelectric response, and domain wall conductivity²,³. Piezoresponse Force Microscopy (PFM) is an indispensable tool for probing nanoscale electromechanical behavior in ferroelectric materials⁴. However, conventional PFM techniques, such as OR-PFM and CR-PFM, have inherent limitations. While CR-PFM can improve the signal-to-noise ratio by operating at the contact resonance, the resonance frequency often shifts during scanning, primarily due to topographic variations. If the electrical excitation frequency is not adjusted in real time to follow these shifts, the piezoelectric signal acquired by the probe will contain topographic artefacts, hindering accurate detection of the sample’s true electromechanical properties⁴,⁵.
The implementation of DFRT-PFM has historically required external lock-in amplifiers to provide sufficient signal processing capability, as earlier-generation AFM controllers were not optimized for handling dual-frequency excitation and real-time resonance tracking. While effective, this setup increased system complexity and cost, making DFRT-PFM less practical for routine use. Park Systems has addressed these limitations by integrating dual-frequency tracking functionality into the controller of its latest FX series (FX40, FX200, FX300), eliminating the need for additional external hardware and enabling seamless switching between modes and even probes directly through the software. By employing dual-frequency resonance tracking alongside a separate excitation channel for the piezoresponse, DFRT-PFM maintains stable, high-sensitivity measurements even as resonance conditions evolve. This enables precise visualization and analysis of complex domain structures, polarization switching, and local electromechanical responses across a wide range of functional materials⁶.
In this application note, we show high resolution domain imaging on CIPS and analyze line profiles to verify minimal topographic interference (Fig. 1). Second, we extract local piezoresponse (PR) curves that display the characteristic butterfly amplitude and 180° phase switching, confirming out-of-plane polarization reversal in CIPS (Fig. 2). Third, we compare DFRT with the conventional PFM techniques at the same sites to highlight improvements in image quality and reduction of lateral noise-like artifacts (Fig. 3). Finally, we validate simultaneous vertical and lateral DFRT-PFM on a benchmark relaxor ferroelectric, PMNPT, to exemplify sensitivity to in-plane responses alongside out-of-plane contrast in a single scan (Fig. 5).
DFRT-PFM measurements of CIPS sample
To demonstrate the capabilities of DFRT-PFM, high-resolution imaging was performed on a CIPS sample under ambient conditions. In Fig. 1, the PFM Amplitude and Phase from the dual tracking of the vertical contact resonance are shown. Domain walls and orientations can be distinctly resolved from the Amplitude and Phase channels, respectively. The results confirm that DFRT-PFM enables clear visualization of ferroelectric domains without visible topographic crosstalk arising from tip–sample contact variations.
To further validate the minimal influence of topography on the PFM signals, line profiles were extracted along the red line indicated in the images. As shown in Fig. 1(B), these profiles reveal that the lower region in the topography shows negligible correlation with the PFM amplitude and no impact on the PFM phase. The amplitude profiles show minima at domain walls, while the phase profiles exhibit a full 180° shift, which confirms the presence of oppositely oriented out-of-plane polarization.
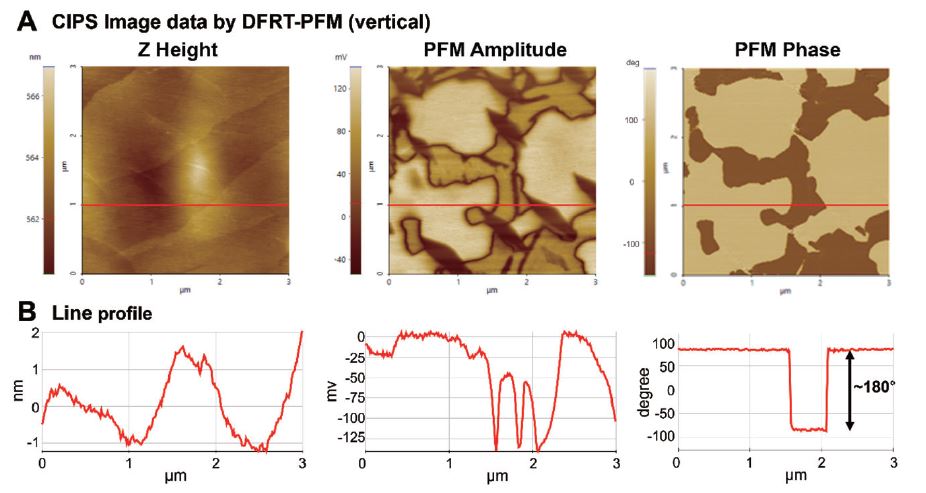
Figure 1. Vertical DFRT-PFM data of a CIPS sample. (A) Simultaneously acquired topography (height channel), PFM amplitude, and PFM phase images. A line profile is extracted along the red line shown in the images. (B) Line profiles show the expected amplitude minima at domain walls and a 180° phase shift, indicating antiparallel polarization with negligible topographic interference. The corresponding DFRT-PFM measurement conditions were as follows: 1 V AC amplitude for a contact resonance of 350 kHz with modulation frequency of 3 kHz, cantilever Spark 70 Pt, 256 × 256 pixels, scan rate of 0.3 Hz, and scan size 3 × 3 μm².
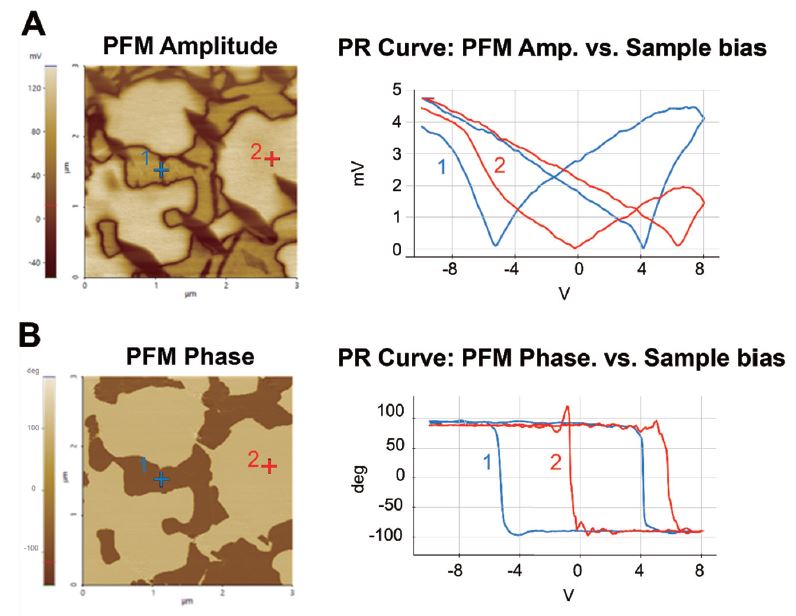
Figure 2. Piezoresponse (PR) curves at selected positions on the CIPS sample. (A) PR curves extracted from two different locations in the PFM amplitude image. (B) PR curves from the same locations extracted from the PFM phase image. The corresponding DFRT-PFM measurement conditions were as follows: 1 V AC amplitude for a contact resonance of 350 kHz with modulation frequency of 3 kHz, cantilever Spark 70 Pt, 256 × 256 pixels, scan rate of 0.3 Hz, and scan size 3 × 3 μm².
To further investigate the electromechanical response of the CIPS sample, two single-point measurements of the piezoresponse (PR) curve at two chosen positions based on the PFM mapping were carried out, and the corresponding PR curves are shown in Fig. 2. The amplitude curves exhibit proper characteristic butterfly-like shapes, while the phase curves show sharp 180° switching behavior, both of which are indicative of out-of-plane ferroelectric polarization reversal. These well-defined PR responses confirm the switchable polarization of CIPS and highlight the capability of DFRT-PFM for localized quantitative analysis of ferroelectric behavior.
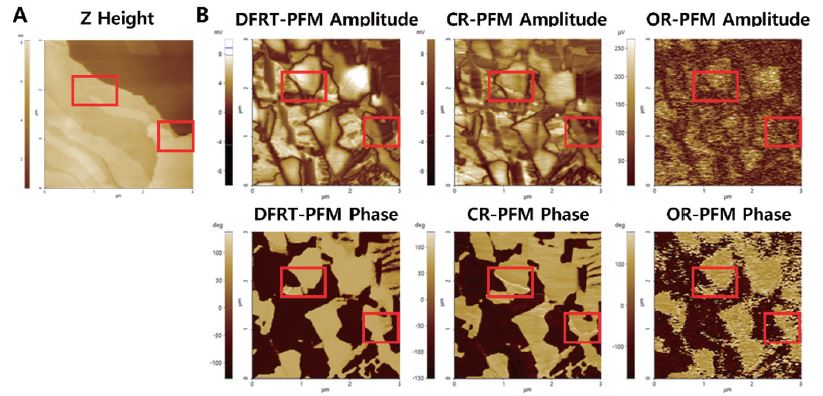 Figure 3. Comparison of PFM signals of the CIPS sample by various PFM methods. (A) Simultaneously acquired topography (height channel). (B) PFM signals including amplitude and phase measured by DFRT, CR, and OR methods. The red-colored boxes indicate topographic crosstalk that are not clearly visible in DFRT-PFM data. The corresponding PFM measurement conditions were as follows: cantilever Spark 70 Pt, 256 × 256 pixels, scan rate of 0.3 Hz, and scan size 3 × 3 μm².
To compare DFRT-PFM with conventional PFM techniques, including OR-PFM and CR-PFM, we performed measurements at the same location on the CIPS sample using identical measurement parameters, as shown in Fig. 4. The resulting data include topography from the height channel (Fig. 4A) and vertical PFM amplitude and phase images (Fig. 4B) acquired using the three different PFM approaches. The DFRT-PFM results clearly resolve features in high resolution without noticeable lateral noise. In contrast, both conventional methods exhibit lateral noise-like artifacts, and many features are poorly resolved in the OR-PFM data. A notable example, highlighted in the red-colored boxed areas of Fig. 4B, is a diagonal boundary feature that is distinct in the topography and CR-PFM signals but barely visible in the DFRT-PFM signals. Without prior knowledge of the domain structure, such artifacts make it difficult to distinguish genuine PFM responses from topographic crosstalk, potentially leading to errors in data interpretation.
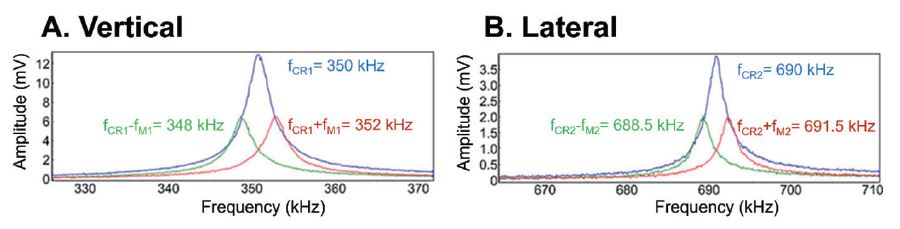
Figure 4. Frequency spectra of the AC voltage between tip and sample in contact with AC amplitudes of 1 V on the carrier signal and both sidebands. (A) The vertical contact resonance (fCR1) was at 350 kHz, and both sidebands (SB) were generated 2 kHz from CR1. (B) The lateral contact resonance (fCR2) was at 690 kHz, and both SB were generated 1.5 kHz from CR2.
For the DFRT measurements, we used two input channels of the lock-in amplifier to acquire the vertical and lateral cantilever displacements from the FX AFM system. An AC excitation voltage at the respective vertical and lateral resonance frequencies was applied directly to the cantilever. The frequency spectra of the vertical contact resonance at 330 kHz (1 V AC amplitude) and the lateral contact resonance at 625 kHz (1 V AC amplitude) are shown in Figures 5a and 5b. For both vertical and lateral signals, the sidebands were located at ±3 kHz from the contact resonance.
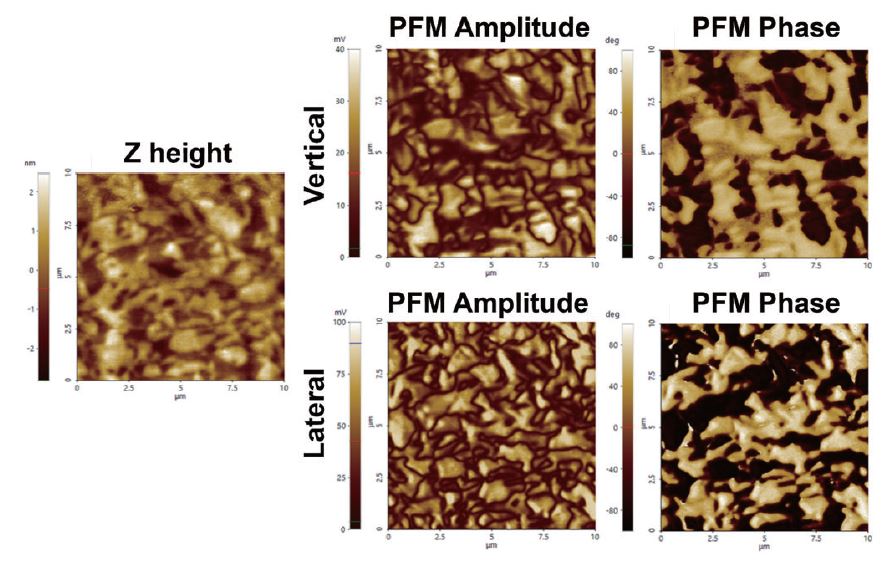
Figure 5. Results of simultaneous vertical and lateral DFRT-PFM measurements on a PMN-PT sample. The figure shows sample topography from the height channel, along with vertical and lateral PFM amplitude and phase images acquired in the same scan. The corresponding DFRT-PFM measurement conditions were as follows: 1 V AC amplitude for a vertical contact resonance of 350 kHz with modulation frequency of 3 kHz, 1 V AC amplitude for a lateral contact resonance of 690 kHz with modulation frequency of 3 kHz, cantilever Spark 70 Pt, 256 × 256 pixels, scan rate of 0.3 Hz, and scan size 10 × 10 μm².
We also tested the capability of DFRT-PFM for simultaneous vertical and lateral measurements. In this case, a PMN-PT (lead magnesium niobate–lead titanate) single crystal sample was used. PMN-PT is a well-known relaxor ferroelectric material with exceptionally high piezoelectric coefficients and strong electromechanical coupling, making it a benchmark material for high-performance actuators, sensors, and transducers⁷,⁸. Its complex domain structure and strong anisotropy provide an ideal platform for evaluating the performance of advanced PFM techniques⁹.
For the measurement, the two input channels of the FX AFM electronic controller were used to acquire the vertical and lateral cantilever displacements from the FX series AFM systems and feed them into the lock-in amplifiers. An AC excitation voltage was applied separately at the vertical and lateral resonance frequencies directly to the cantilever. Sideband frequency feedback loops were engaged to track the vertical and lateral resonances in real time during scanning.
With DFRT-PFM imaging, clear domain walls were resolved in both vertical and lateral PFM signals, with very minimal crosstalk from topography, demonstrating stable and effective DFRT feedback operation. The lateral PFM amplitude image in Fig. 5 showed contrast patterns distinct from those in the vertical channel, indicating sensitivity to in-plane piezoresponse components in the PMN-PT sample¹⁰. This observation confirms that the lateral DFRT-PFM measurement successfully captured the anisotropic electromechanical response characteristic of PMN-PT, rather than the out-of-plane contrast observed in the vertical channel¹¹.
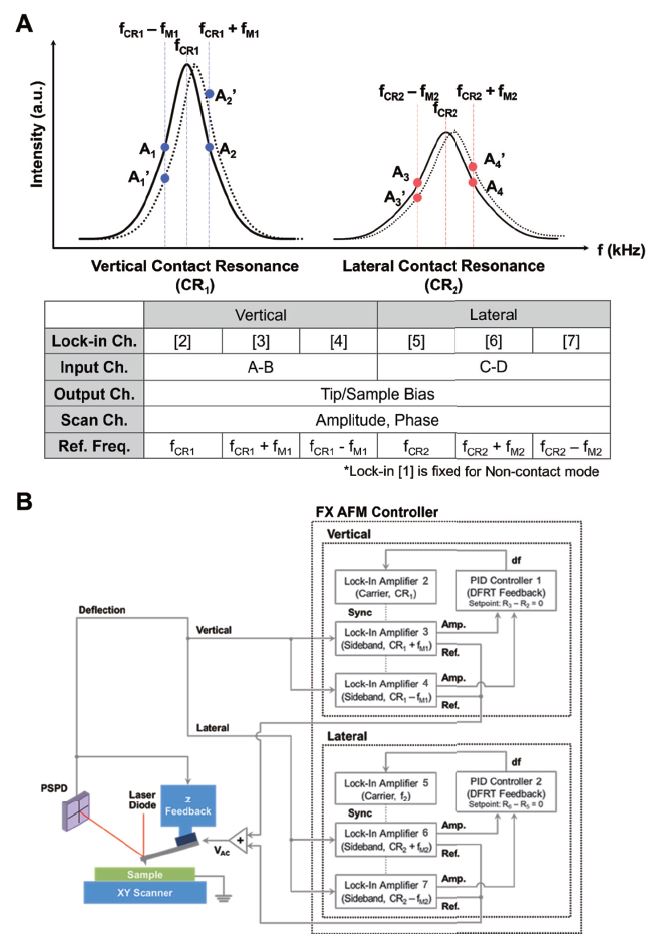
Figure 6. Simplified schematic of DFRT-PFM operation. (A) and (B) show the multi-lock-in amplifier configurations used to simultaneously acquire vertical and lateral piezoresponse signals.
Lastly, as for the DFRT operation, Fig. 6 summarizes the multi-lock-in amplifier configuration used for DFRT-PFM measurements that simultaneously acquire vertical and lateral piezoresponse signals. In the vertical channel, three reference frequencies are used: the contact resonance frequency fCR1, and its sidebands fCR1+fM1 and fCR1−fM1. These enable real-time tracking of resonance shifts and precise detection of vertical electromechanical response. For lateral signals, an additional set of lock-in amplifiers operates at fCR2, fCR2+fM2, and fCR2−fM2, allowing sensitive measurement of in-plane piezoresponse. The system uses two separate input channels (A–B for vertical, C–D for lateral), while the output controls the tip/sample bias. Amplitude and phase data are captured from each lock-in, allowing comprehensive mapping of complex piezoelectric behavior in both directions. This multi-frequency, multi-lock-in approach provides high signal fidelity, stable resonance tracking, and accurate separation of vertical and lateral responses, supporting reliable high-resolution characterization of ferroelectric and piezoelectric materials.
Conclusion
DFRT-PFM on Park Systems’ FX Series AFM systems provides stable, high-sensitivity ferroelectric characterization with reduced topographic and mechanical crosstalk. On CIPS, DFRT enables clear domain imaging and well-defined local switching curves, outperforming OR-PFM and CR-PFM in signal fidelity and feature resolution. Simultaneous vertical and lateral measurements on PMN-PT further confirm robust separation of out-of-plane and in-plane piezoresponses within one scan. These results demonstrate DFRT-PFM as an effective and practical approach for advanced ferroelectric and piezoelectric materials research.
Related Contents

Solving Thin-Film Uniformity Challenges on Curved Surfaces with Imaging Spectroscopic Ellipsometry
Spectroscopic Imaging Ellipsometry at Cryogenic Temperatures Applied to Atomically Thin Crystals