James Kerfoot1
1Park Systems UK Ltd, Medicity Nottingham, D6 Building Thane Road, NG90 6BH, UK
Abstract
Future technologies require electronic devices with greater computational power and lower energy consumption. Integrating ferroelectric materials into them is a great way to achieve this as they enable the realisation of high-performance transistors with inbuilt memory. To refine and miniaturise this material platform however requires techniques able to elucidate ferroelectricity on the nanoscale, a requirement uniquely suited to atomic force microscopy (AFM) and its associated functional variants that are sensitive to piezo response, surface potential and local conductivity. In this application note we explore these modes and their application to ferroelectric materials for next-generation devices.
Introduction
Memristive devices are those which may be switched between conductive states based on previous conditions, with applications in neuromorphic computing [1, 2]. These devices rely upon the alteration of the state of a material, typically via mechanisms including dielectric breakdown of an insulating layer [3,4] or switching ferroelectric states [5] within a material. Recently, ferroelectricity has been demonstrated in layered materials homostructures of both hexagonal boron nitride [5-8] and transition metal dichalcogenides [9, 10] with a controlled twist angle. In such systems, it has been shown that a superlattice of domains with out-of-plane electric fields occur [6,11] and can be manipulated via layer sliding in the in-plane direction induced by external bias [7,11].
Here, we measure domain morphology and perform switching experiments in parallel stacked (0°) hBN on few-layer graphene (FLG) via a voltage applied with an AFM probe. Most interestingly, we find that the tunnelling current measured in conductive AFM (C-AFM) between the FLG and the probe through a parallel stacked hBN bilayer depends upon the domain registry and that this registry can be both mapped and manipulated.
Results and Discussion
The twist angle in layered material homostructures may be controlled by the so-called ‘tear and stack’ technique [12], in which a flake is deterministically torn during the pick-up process and re-stacked with a controlled twist angle. In the case of hBN, alternating layers stack with an inter-layer angle of 60°, with boron atoms sat directly on top of nitrogen atoms on the bottom layer and vice versa, see fig 1b. Upon forming a parallel stacked interface with a twist angle of ~0°, a structure occurs in which different species of atoms are stacked directly at one site and sit at the centre of the hexagons at another, see figure 1c. In this structure, an out-of-plane electric field not present in the bulk occurs owing to the charge distribution of intra-layer bonds between boron and nitrogen [6], moreover, the direction of the electric field is flipped upon a translation between the layers [7].
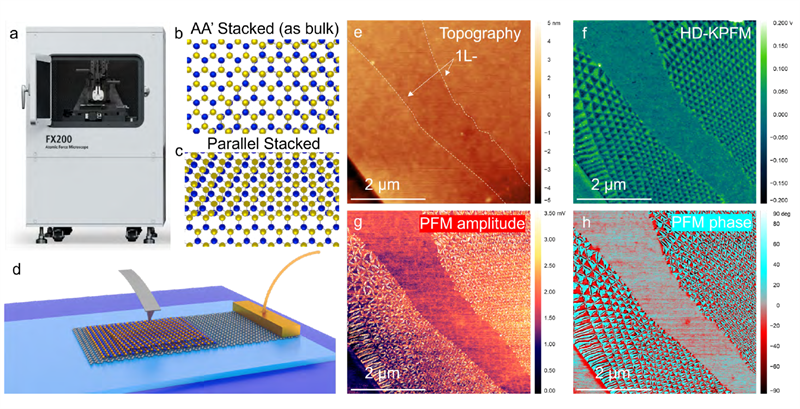
Figure 1. The Park Systems FX200 automatic AFM used for measurements is shown (a) in addition to illustration of the stacking order in naturally occurring AA' (b) and parallel stacked AB or BA (c) hBN. KPFM measurements were performed on parallel stacked bilayer hBN on graphene (d), enabling both the surface topography (e), and contact potential difference (f) to be mapped, revealing ferroelectric domains. The same region was also probed using DFRT-PFM, with an identical domain morphology visible both in PFM amplitude (g) and phase (h).
Such a parallel stacked (~0°) hBN (consisting of a ~2 nm thick top flake and ~8 nm thick bottom flake) on graphene was first measured using AFM and heterodyne Kelvin probe force microscopy (HD-KPFM), see figures 1e and f. Measurements were performed using the Park Systems FX200 automatic AFM and HD-KPFM is described in our earlier application note [13]. HD-KPFM (as well as latter dual frequency resonance tracking (DFRT-) piezoresponse force microscopy (PFM) and C-AFM measurements) were performed with Pt coated Electri-Multi75 probes (Budget Sensors) with a stiffness of ~3 N/m and resonant frequency of ~75 kHz. The contact potential difference (CPD) map measured using HD-KPFM shows very clear triangular domains which occur exclusively over areas of overlap between the two hBN flakes, with terminations in the superlattice at monolayer (1L-) step edges, as reported in references 5-8. The spatial periodicity of domains seen in figure 1f is seen to vary laterally slightly, which is suggestive of a distribution of strain across the hBN, which was likely imparted during the polymer mediated transfer technique used to prepare the samples. Finally, we note the CPD contrast between triangular domains of positive and negative contrast was measured to be ~200 mV, in good agreement with the results of Woods et al [6] for the smallest tip-sample separations of their lift mode KPFM experiment. In addition to measuring interfacial electric fields via HD-KPFM, DFRT-PFM may be used to measure the electromechanical response of the ferroelectric layer under applied AC bias (VAC), as described in our earlier application note [14]. DFRT-PFM amplitude and phase images (see figure 1g and h) from the same region as figure 1 panel e and f reveal the same domain morphology. In the case of the PFM amplitude image, bright fringes at the edges of the triangular domains [8] likely originate from lateral piezoresponse that is coupled to the vertical PFM channel via cantilever buckling.
To demonstrate the applicability of conductive AFM (C-AFM), we consider a second sample in which the parallel stacked hBN thickness is reduced to the bilayer limit (~0.6 nm), which enables the underlying graphene to be addressed electrically via tunnelling across the hBN layer. We demonstrate this by performing C-AFM, as done by Summerfield et al [15], on an area of the sample pre-mapped using KPFM. In C-AFM, the surface topography is mapped via a feedback loop using the probe deflection as the feedback parameter. In this way, the topography is measured with a constant force applied between the tip and sample and the current map at constant voltage is acquired simultaneously. C-AFM maps of the parallel stacked hBN bilayer on graphene reveal a stable tunnelling current with clear contrast between domains of each type, moreover the morphology of domains mapped using C-AFM at low voltage (<0.3 V) is in excellent agreement with earlier KPFM measurements, see figure 3 a, b and c. This initial result shows C-AFM enables the response of the morphology of domains to both the tip-sample bias (VTS) and the mechanical force to be explored independently.
In order to study the response of the domain morphology to applied external electric fields, we performed >100 sequential C-AFM measurements over the same area of the ferroelectric bilayer hBN with increasing sample bias and the same mechanical setpoint (~30 nN). At biases of less than 0.3 V, the domain morphology did not change significantly between images. As the tip sample bias increased however, the boundaries of domains shifted such that the total areal coverage of domains of one type increased depending upon the direction of the applied bias, see figure 2d.
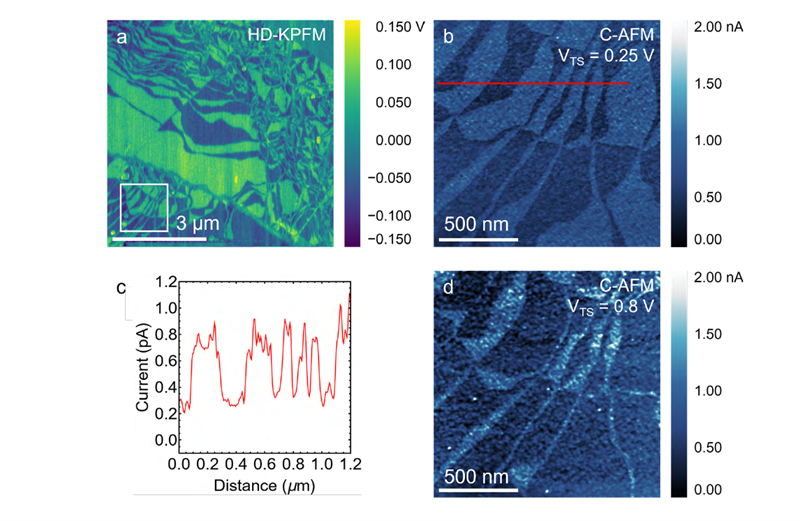
Figure 2. The thickness of the parallel stacked bilayer hBN (~0.6 nm) facilitates the measurement of a tunnelling current between the underlying graphene and a metal coated probe. C-AFM was performed on the sample, with the domain morphology clearly distinguishable in both KPFM, a, and the conductive AFM current channel b. Line profiles extracted from the current channel (VTS=0.25 V) reveal a significant contrast between domains of differing registry, which we attribute to the influence of the differently oriented interfacial electric fields across different domains, c. It was found that the domain morphology was changed in favour of domains of lower current upon applying higher bias to the sample, d.
The total areal coverage of domains of lower conductivity (as seen in figure 2b) was extracted from current maps by thresholding and is shown plotted versus sequence number in figure 3a where red and blue points denote positive and negative sample biases from ±0.2 to ±1 V. As seen in figures 3 a and b, the skew in areal coverage between domains of each type generally increases monotonically with applied voltage rather than in a stepwise fashion with a characteristic threshold voltage. The observed change in the domain morphology suggests that domain boundaries preferentially slip such that the interfacial charges in the ferroelectric layer interact attractively with those accumulated in the tip and sample. In addition to the change of relative areal coverage of domains of one type, we also observe that the number of boundaries between domains and the position of the domain vertices generally does not change, likely due to the energetic cost of sliding an existing interface being much lower than the cost of introducing a new one. The effective bias observed on domains of high and low conductivity was extracted and plotted against applied bias, yielding the effective current voltage curve seen in figure 3c. While the need to precisely track the condition of the probe during imaging complicates robust current vs voltage characterisation, we broadly see a monotonic increase in the absolute magnitude of the current measured on domains of each type in addition to higher conductivity from domains of higher current in image 2b, regardless of the direction of the applied external bias.
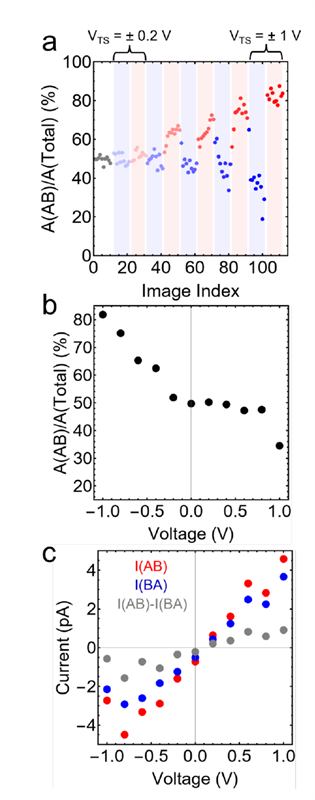
Figure 3. By performing sequential C-AFM scans at the same mechanical setpoint and increasing VTS, maps of the domain morphology were acquired. The areal coverage of domains of high and low current were extracted via thresholding and plotted against imaging sequence, a. The maximum achievable areal density of domains of each type was then estimated from last image in the sequence for each voltage, b, in addition to the average current over domains of each type, c.
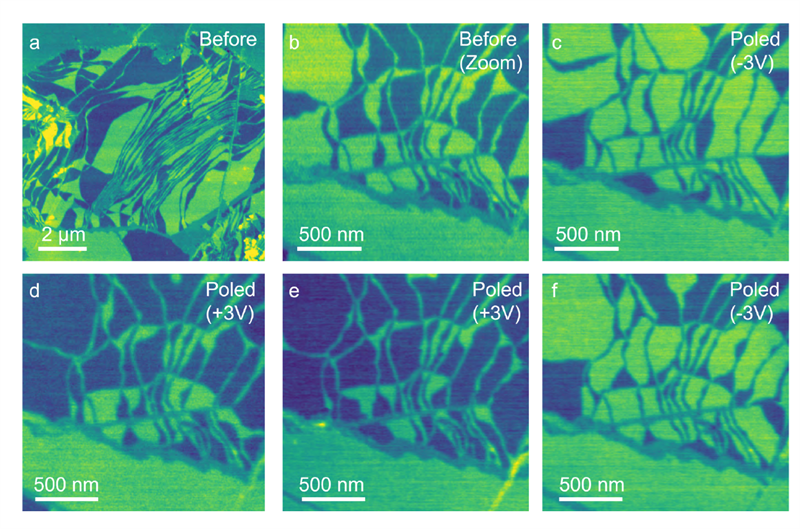
Figure 4. To investigate the response of the domain morphology to applied external bias, a smaller area of the same sample (a,b) was mapped using HD-KPFM before bias was applied between the probe and sample with the probe held in contact with the surface using contact mode. Upon performing a poling scan with the applied sample bias sequentially flipped from -3 V to +3 V, changes in the distribution of domains of positive and negative contrast correlated with the poling was observed in each the subsequent KPFM image (c-f).
In addition to manipulating domain morphology using conductive AFM, it is also possible to manipulate morphology by applying voltages between the tip and sample with the tip in contact with the sample. By performing measurements in contact mode with a user defined sample bias, we alter the distribution of domains, in the same manner as previously shown by Vizner Stern et al [7], see figure 4. Comparing the domain morphology measured using KPFM before (see figure 4b) and after (see figure 4c-f) poling scans with a tip bias of ±3V, changes in the coverage of domains of each type may be deterministically controlled. In addition to the demonstrated domain control, the persistence of specific vertices is in excellent agreement with C-AFM measurements.
Conclusions
It has been shown that HD-KPFM, DFRT-PFM and C-AFM can all be used to measure the domain morphology in ferroelectric superlattices formed at the interface of parallel stacked hBN flakes. By utilising the ability of Park Systems FX series AFMs to automatically exchange the probe and switch between electrical modes, we perform more sophisticated experiments where we correlate HD-KPFM to tunnelling currents measured with C-AFM over a sequence of >100 scans with differing VTS. Finally we show how contact mode AFM under a fixed VTS may be used to deterministically switch the distribution of domains within a ferroelectric superlattice sample.
References
- M. Lanza et al. Memristive technologies for data storage, computation, encryption, and radio-frequency communication. Science 376, 6597 (2022) DOI: 10.1126/science.abj9979
- Y. Shi et al. Electronic synapses made of layered two-dimensional materials. Nat. Electron. 1, 458–465 (2018). https://doi.org/10.1038/s41928-018-0118-9
- S. Pi et al. Memristor crossbar arrays with 6-nm half-pitch and 2-nm critical dimension. Nature Nanotech 14, 35–39 (2019). https://doi.org/10.1038/s41565-018-0302-0
- S. Chen et al. Wafer-scale integration of two-dimensional materials in high-density memristive crossbar arrays for artificial neural networks. Nat Electron 3, 638–645 (2020). https://doi.org/10.1038/s41928-020-00473-w
- A. Chanthbouala et al. A ferroelectric memristor. Nature Mater 11, 860–864 (2012). https://doi.org/10.1038/nmat3415
- C. R. Woods et al. Charge-polarized interfacial superlattices in marginally twisted hexagonal boron nitride. Nat Commun 12, 347 (2021).
- M. Vizner Stern et al. Interfacial ferroelectricity by van der Waals sliding. Science 372, 1462 (2021)
- K. Yasuda et al. Stacking-engineered ferroelectricity in bilayer boron nitride Science 372, 1458 (2021)
- S. Chiodini et al. Moiré Modulation of Van Der Waals Potential in Twisted Hexagonal Boron Nitride. ACS Nano 16, 5, 7589–7604 (2022)
- X. Wang et al. Interfacial ferroelectricity in rhombohedral-stacked bilayer transition metal dichalcogenides Nat. Nanotechnol. 17, 367–371 (2022). https://doi.org/10.1038/s41565-021-01059-z
- A. Weston et al. Interfacial ferroelectricity in marginally twisted 2D semiconductors Nat. Nanotechnol. 17, 390 (2022)
- K. Kim et al. van der Waals Heterostructures with High Accuracy Rotational Alignment. Nano Lett. 9 16 (3): 1989–1995 (2016)
- https://www.parksystems.com/en/learning-center/lc-detail.app_250526003
- https://www.parksystems.com/en/learning-center/lc-detail.CIPS_sample_by_DFRT-PFM_w_FX_controller
- A. Summerfield et al. Moiré-modulated conductance of hexagonal boron nitride tunnel barriers Nano Lett. 18, 7, 4241–4246 (2018)