


Optical Properties Of Human Dental Enamel
Introduction
Dental enamel is one of the major tissues that make up the tooth in vertebrates. It is the hardest and most highly mineralized substance in the human body. To answer a number of questions, like aesthetic aspects of dental restorations, efficiency of tooth cleaning or the quantification of discoloration by adsorption of chromogens from tobacco, coffee, or tea, the optical characterization of human dental enamel is of high scientific and technical relevance.
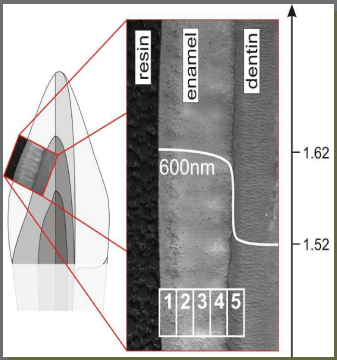
Figure 1. human incisors - location of dental enamel.
Sample preparation
The tooth samples consist of retained or partial retained molars and incisors. Before use, the teeth were pruned of biological remains and disinfected. The teeth were cut into cross sections and were embedded in acrylic resin. During the last preparatory treatment, the enamel samples were sanded with successfully finer grains and polished.
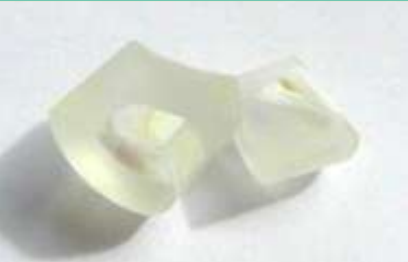
Figure 2. human molars and incisors, embedded in polymer resin.
Ellipsometric contrast
Fig. 3 shows the enamel of a human incisor. The dark, foam like part is the resin that was used to embed the teeth, the left grey part represents dentine.
The orientation of polarizer and analyzer in the pathway of light of an imaging ellipsometer can be selected in a way that optimizes the contrast between substrate and thin films or areas of deferring optical properties. The first step is to detect the nulling conditions of one area of interest. The next is to find a good compromise between lightness and contrast. The next step is to perform quantifed measurements like Delta and Psi maps.
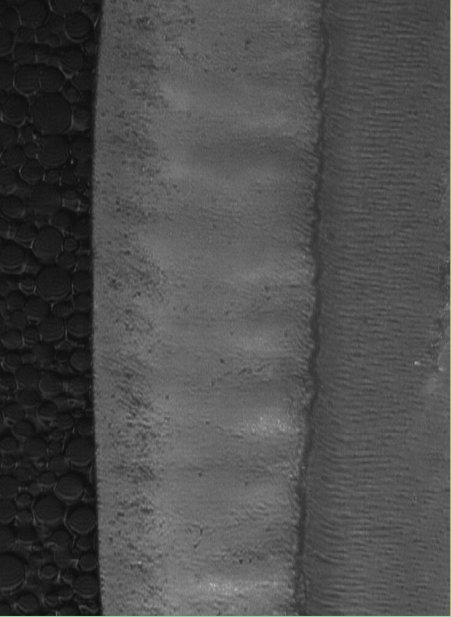
Figure 3. Ellipsometric contrast micrograph of human dental enamel.
Delta and Psi maps
Delta and Psi maps are based on a number of images taken at changing orientations of the polarizer and analyzer (Fig. 4 a). In general, the ellipsometric angles were obtained by analyzing the minimum in grayscale distribution for each pixel (Fig. 4b). In our case, a binning of 2 was applied.
Different areas of a human incisor were mapped. In Fig. 5, the exact area mapped is displayed in an image of the complete enamel, stitched together out of ellipsometric contrast micrographs. As expected, the Delta map is of low contrast, but the Psi maps look similar to the ellipsometric contrast micrographs. In the case of this study, a 5x objective was used to get an overview but still obtained a very high lateral resolution.
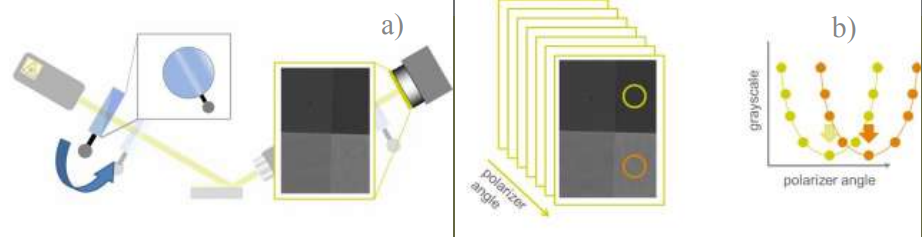
Figure 4. Scheme of recording a map.
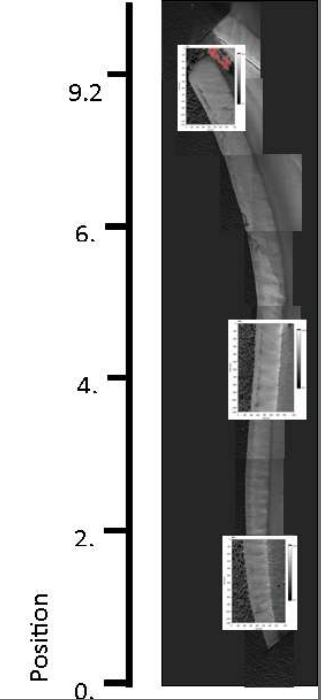
Figure 5. Location of the enamel in side orientation of an incisor
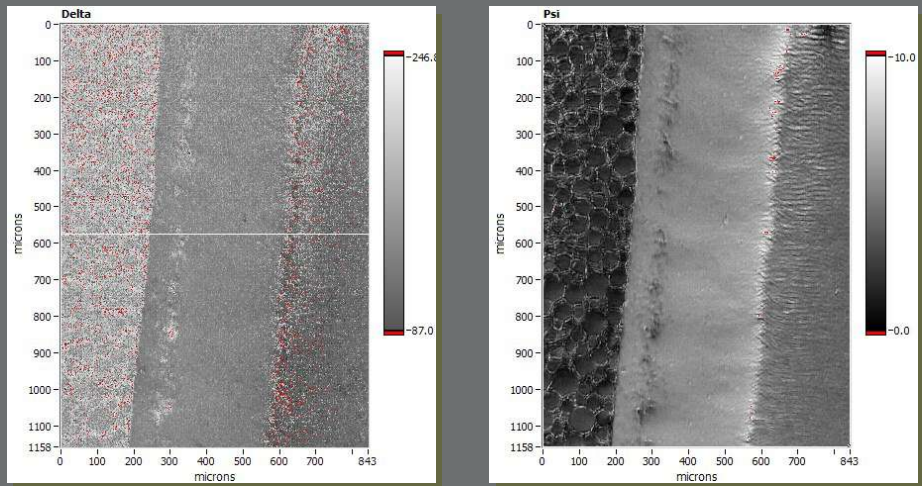
Figure 6. Delta (a) and Psi maps of dental enamel at different positions. (see fig.5)
Knife edge illumination
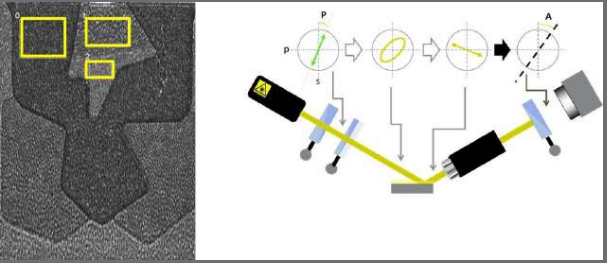
Figure 7 Measurement performed at a region of interest (ROI).
Knife edge illumination is a very simple and non-invasive method that avoids back-surface reflection even on very thin transparent substrates. By cutting the incident light beam, a region free of backsurface reflection is created at the sample, right next to the border of the cutting edge. Key to the technology is the ROI concept of imaging ellipsometry that enables the local detection of the ellipsometric angle Delta and Psi (Fig. 7).
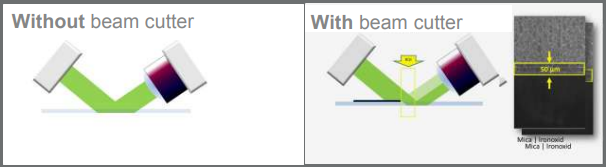
Figure 8. Working principle of a beam cutter
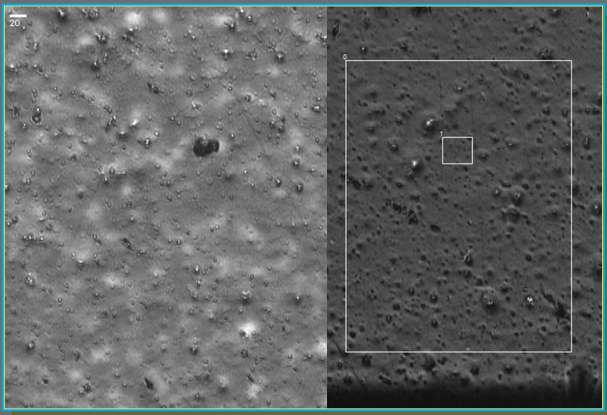
Figure 9. Image of a polymer sample without and with beam cutter.
A ROI can be placed in the shadowed area (Fig. 8) and ellipsometric measurements can be performed. The resulting spectra look like spectra of a transparent bulk substrate and can be analyzed directly. Also the disturbance by scattered light is minimized (Fig. 9).
Single wavelength ellipsometry (658 nm)
For technical use, reporting the refractive index for red light is state of the art. We used a 658 nm laser for single wavelength characterization because of the high image quality obtained with that light source. Fig. 10 shows a refractive index profile based on relatively large regions of interest (ROI). The first twenty ROIs represent enamel, the last five dentin. The refractive index is in good agreement with literature. Depending on the location, significant variations can be seen.
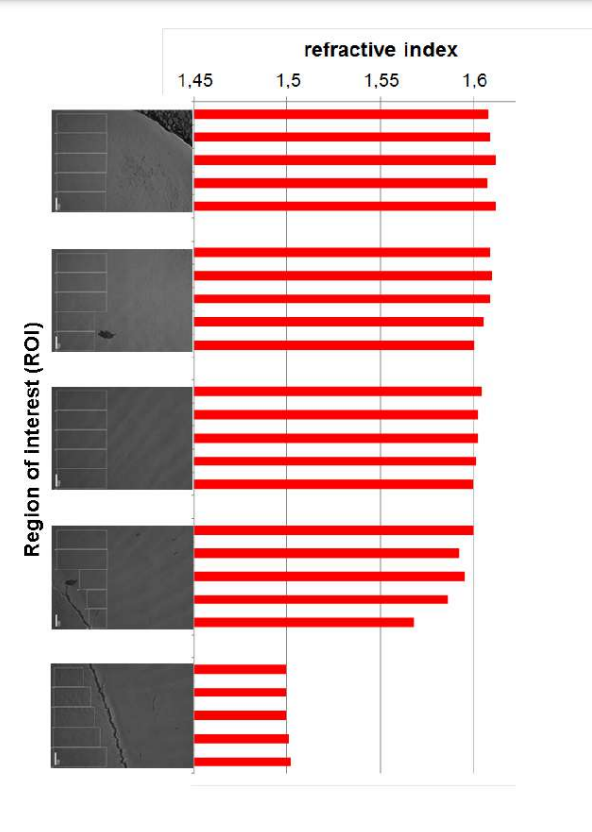
Figure 10 Refractive index profile at 658 nm
Spectroscopic ellipsometry
Wavelength spectra of Delta and Psi were recorded between 360 nm and 1000 nm. Four zone nulling was performed at 20 selected wavelengths. Typical spectra are displayed in Fig. 11. To extract the optical properties, different models of changing complexity were applied, starting with a dispersion function based on the sum of wavelength-independent refractive index and extension coefficient, and two independent Lorentz oscillators. The first simplified approach focused on data in the visible range. It was again based on a constant refractive index and extinction coefficient, but only one Lorentz oscillator was added. The third approach focused on Psivalues between 400 and 950 nm, and only a Cauchy parameterization was applied.
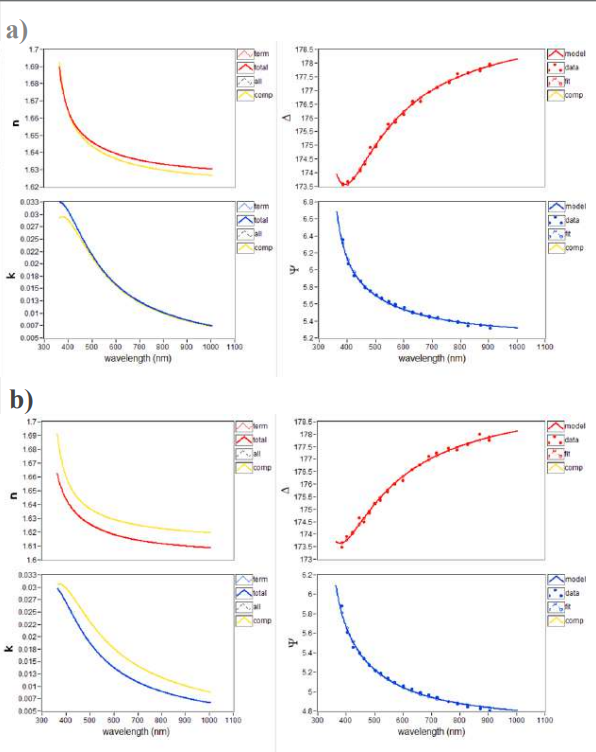
Figure 11. Representative spectra and dispersion function of a molar (a) and incisor (b).
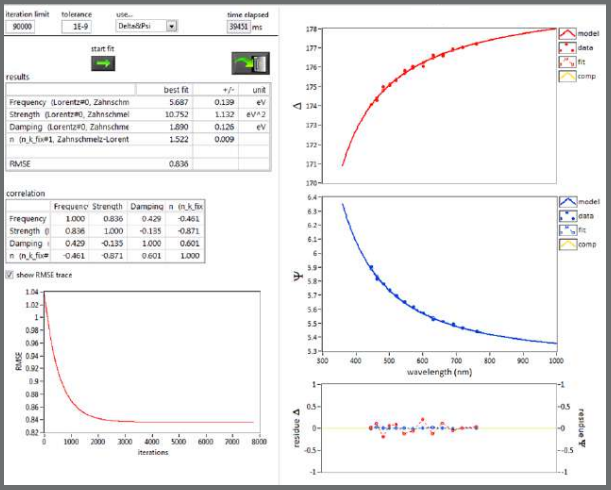
Figure 12. Delta- and Psi-spectrum, best fit, correlation matrix and residue in Delta and Psi of a molar.
The results of the different models vary in absolute numbers but always show the same trends. In Fig. 13 the results based on the Cauchy approach are displayed. There seems to be a significant trend showing the refractive index of the molar as higher than that of the incisor. (For a definitive evaluation, one would have to take into account the location dependency of the refractive index (Fig. 10).)
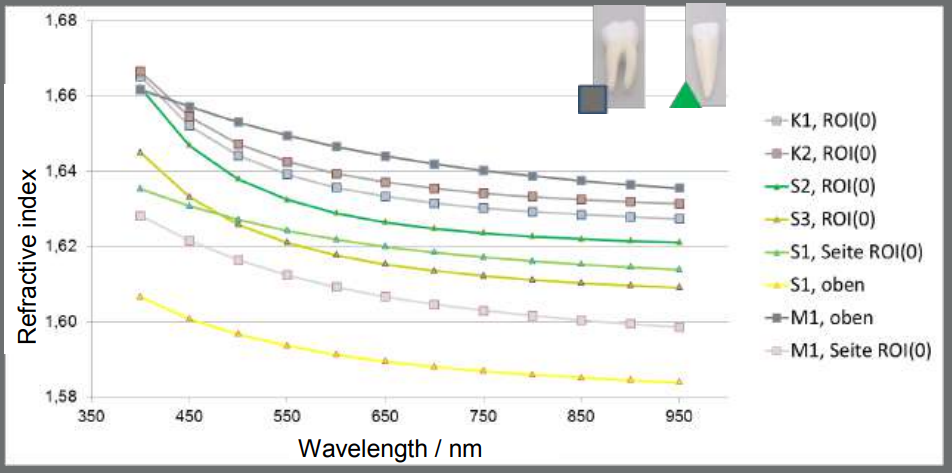
Figure 13. Refractive index of different human molars (grey) and incisors (green).
The knife edge illumination increased the quality of the data. Comparing the refractive index of the different types of teeth, a trend is visible, though a larger number of cases must be studied for higher statistical significance. Our conclusion is that spectroscopic imaging ellipsometry is the method of choice for characterization of the optical properties of human teeth. The choice of the optical model, of course, depends on the level of precision needed.
Both the findings and the new experimental approach to determine the refractive index by the spectroscopic ellipsometry may be useful for analyzing in-vitro de- and re-mineralization processes of enamel in very initial (early) stages, or for the development of dental composites with optimized optical properties.