


Current Trends in Microscopic Characterization: Spectroscopic Imaging Ellipsometry (SIE)
Imaging Ellipsometry
Imaging ellipsometry, combines the power of ellipsometry with optical microscopy. It achieves the highest lateral resolution in the field of ellipsometry and offers a very sensitive imaging technology for thin films. Typical application is the characterization of microstructured thin films. The ep4 is the latest microscopic imaging spectroscopic ellipsometer with unique measurement capabilities. It can provide real-time ellipsometric enhanced contrast images, and maps of the ellipsometric angles Δ and Ψ. These data can be transferred into d and the optical properties by computerized optical modeling.
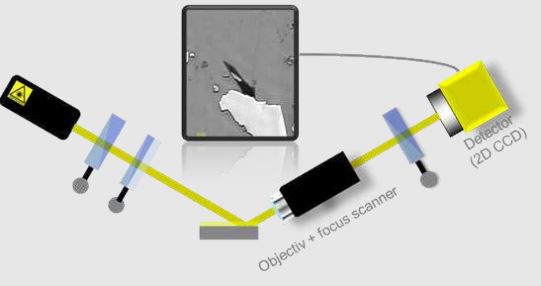
Setup of an imaging ellipsometer including objective and 2D CCD.
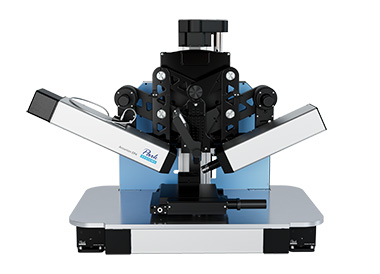
Imaging spectroscopic ellipsometer nanofilm_ep4.
Regions of Interest
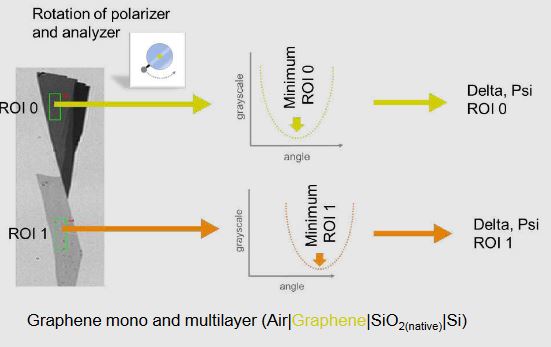
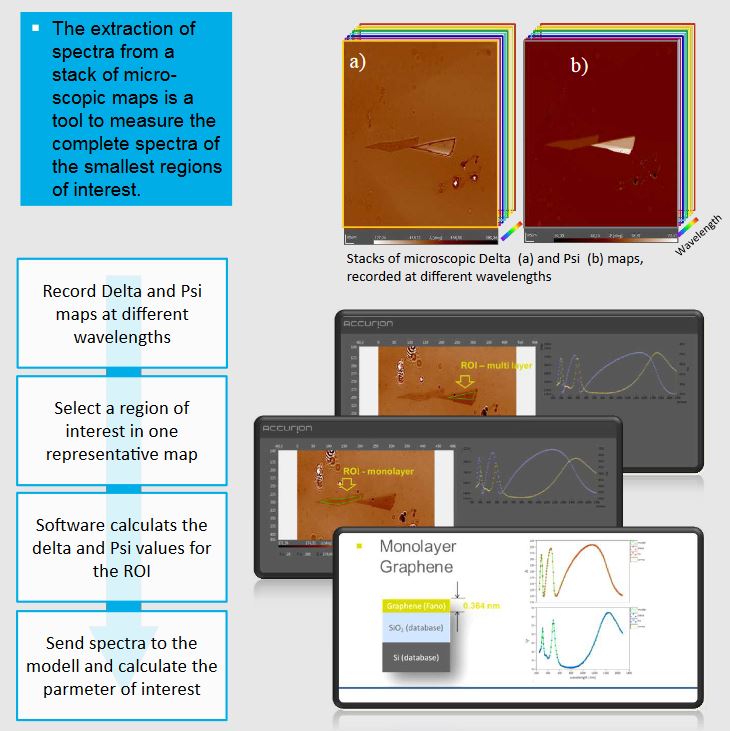
Imaging ellipso- metry offers the option to study portions of the sample by selecting corresponding pixels in the image of the 2D detector.
The intensity changes are recorded only for the pixels, that represent the Region of Interest (ROI). With this method, a much higher lateral resolution is available and similar areas can be measured in parallel.
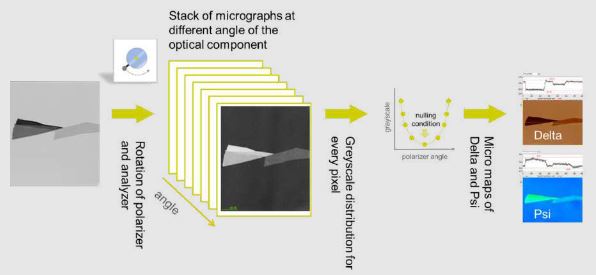
Microscopic Mapping
Microscopic mapping offers the highest lateral resolution in the field of ellipsometry. (down to 1 μm). each pixel works as a single detector.
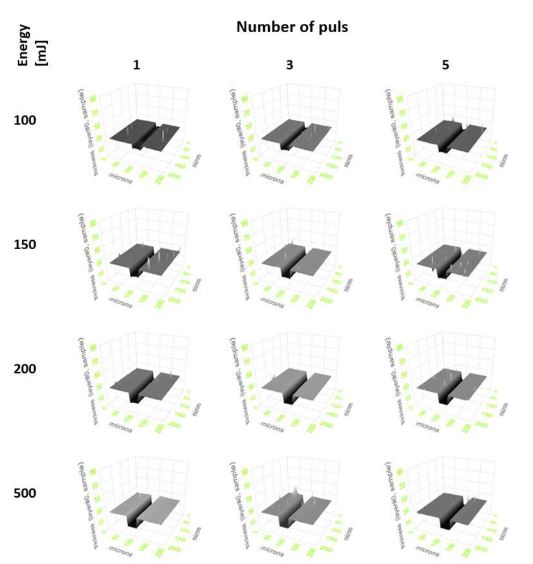
Sample: PMMA | SiO 2 (native) | Si
PMMA was spin-cast on Si/SiO2. The surface was structured by laser ablation by varying the number and power of the laserpuls. The thick- ness maps were calculated out of Delta maps, recorded at an AOI of 50 ° at a wavelength of 500 nm using a 20x objective.
Extracting Wavelength Spectra
Optical Modeling
Calculation of opti- cal- and metrologi- cal parameters for ultrathin films. Effective medium approach (EMA) also offers information about chemical composition.
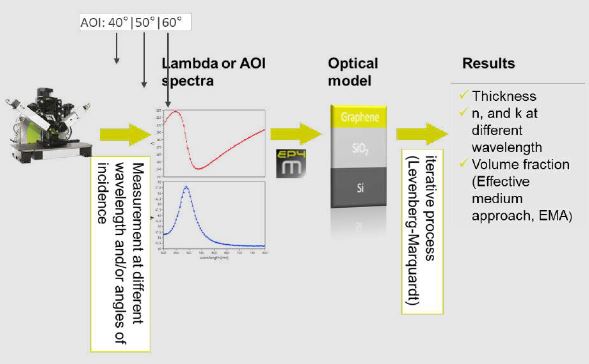
The Drude equation connects the ellipsometric angles Delta and Psi with the Total reflection coefficient of the Fresnel equation and on this track with physical parameters like the complex refractive index and the layer thickness. By using different wavelengths the dispersion function of the layers and/or of the substrate is available. The number of fit parameters is related to the number of measured parameters. To increase the number of parameters, angle of incidence, and wavelength spectra can be measured.
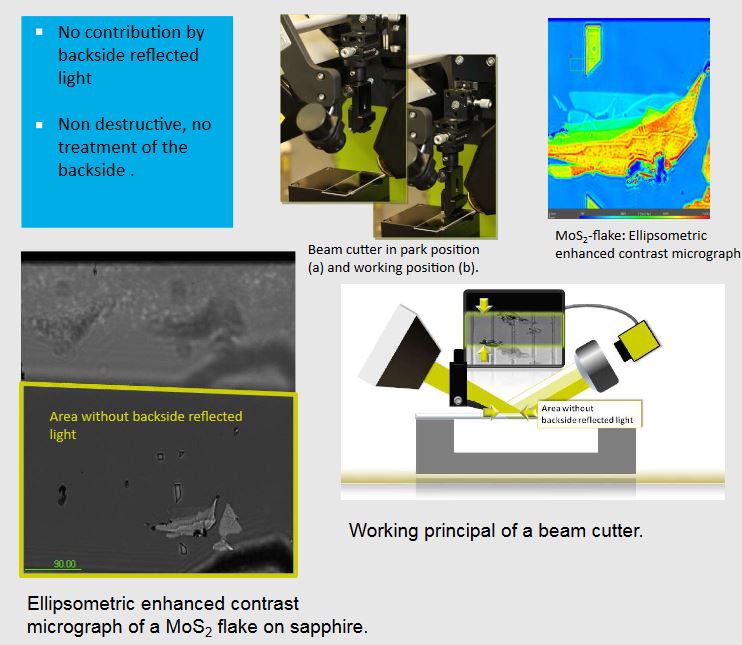
Knife Edge Illumination
Microscopic Müller Matrix
Müller Matrix Ellipsometry is the method of choice for anisotropic samples. First microscopic Müller Matrix Ellipsometry.
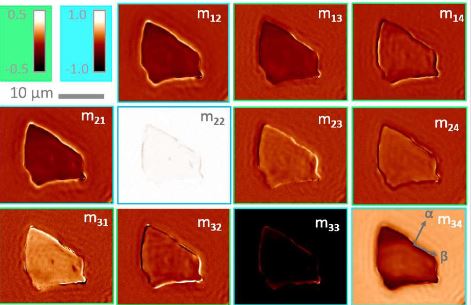
Micromaps of normalized MM (m11 =1) at θ=0° and λ=550 nm. Mind different scale bars for block diagonal (blue frames) and block off-diagonal (green frames) matrix elements. Arrows in m34-graph indicate the orientation of in-plane optical axes obtained from ellipsometric modelling of θ-scan.