


Magnetic force microscopy (MFM) is an atomic force microscopy (AFM) application that is widely used to characterize magnetic properties of various materials at the nanoscale. In this technique, a sharp tip coated with ferromagnetic material scans the surface and maps the distribution and strength of magnetic domains on the sample. MFM mode can be applied to probe the properties of magnetic materials for academic and applied research, e.g. to characterize, evaluate, and develop magnetic storage devices and magnetic recording components such as hard disk media, and magneto-resistive heads as well as to image naturally occurring or deliberately written domain structures in magnetic materials.
MFM mode uses Non-contact mode to detect the surface topography of the sample. At the same time, the MFM image is generated by measuring the amplitude and phase of cantilever oscillation. These signals contain information about magnetic domain distributions of the sample surface. MFM can be used to image naturally occurring or deliberately written domain structures in magnetic materials.
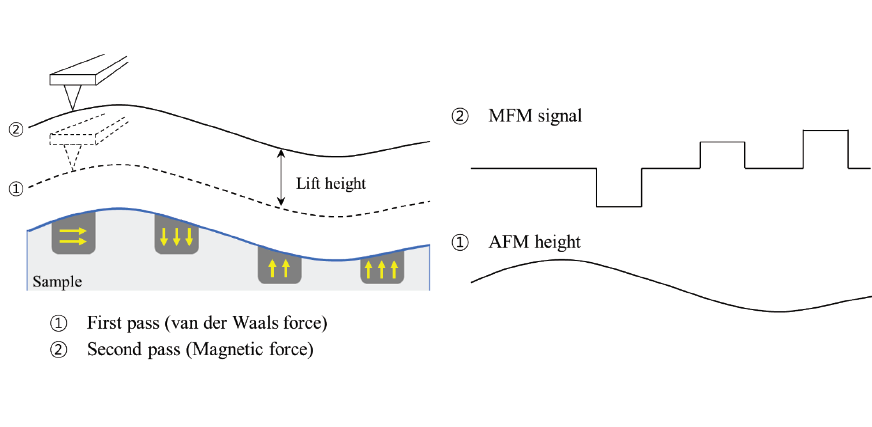
Figure 1. The schematic of ‘Dual Pass’ technique (lift mode) used for MFM on an exemplary sample structure containing multiple different magnetizations. The topography signal (①) is obtained in the first pass scan close to the sample and the MFM signals amplitude and phase (②), which capture the relative strength and orientation of the magnetization, respectively, is obtained in the second scan.
During the MFM measurements, two forces acting between tip and sample: van der Waals and magnetic forces. The van der Waals force such as repulsive and attractive forces are stronger at close distances between tip and sample while magnetic forces are stronger at long distance from the sample. While the van der Waals force is proportional to 1/r6, the magnetic force is proportional to 1/r2 (r: distance between two atoms on tip end and sample surface). MFM mode utilizes this difference in force gradient to separate the contributions of these two forces. At a relatively small tip-sample distance, where the van der Waals force is dominant, the non-contact imaging can be performed to collect topographic information. By increasing the tip-sample distance, MFM signal can be collected in the region where magnetic force becomes dominant. The key to obtain a good MFM result lies in separating the magnetic signal from the entire signal. In MFM mode, a ‘Dual Pass’ technique (called ‘lift mode’) is a good option for clear MFM result.
In MFM mode, the sample is scanned twice to separate the signal as shown in figure 1. In the first scan, the tip scans the sample surface as in Non-contact mode to obtain the topography of the sample surface as shown in figure 1(①). In the second scan, when the tip-sample distance has increased the tip is only affected by the magnetic force. The magnetized tip is controlled to move along the topography line obtained from the first scan. The MFM image is obtained as a result as shown in figure 1(②).
In the topographical line, the tip is maintained in constant tip-sample distance which equals a constant van der Waals force. So, when the tip follows the topography line in the second scan of ’MFM mode’, the van der Waals forces acting on the tip are kept constant. Thus, the only change in force affecting the signal is the change of the magnetic force. Accordingly, the MFM image, free of topography signal, can be obtained from the second scan.
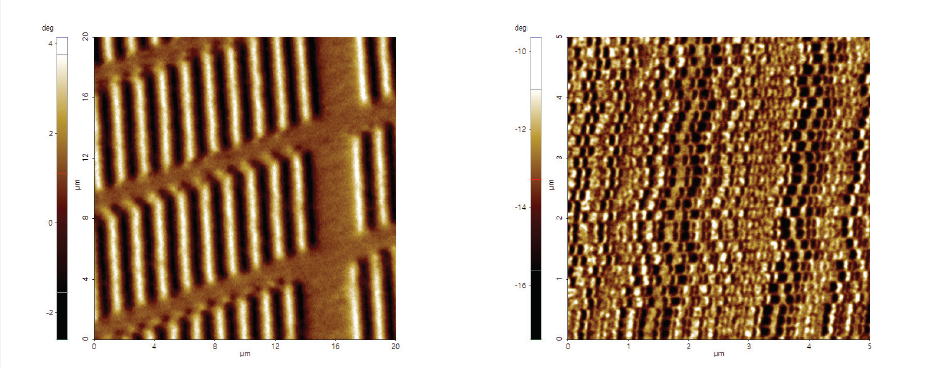
Figure 2. Comparative MFM measurements on magnetic domain pattern for data storage recorded via (a) LMR and (b) PMR. MFM phase images demonstrate how a higher domain density achieved by PMR as compared to LMR.
As previously mentioned, MFM mode is a widely used technique in the field of magnetic storage devices. There are several magnetic recording methods: heat-assisted magnetic recording (HAMR), longitudinal magnetic recording (LMR), perpendicular magnetic recording (PMR), and shingled magnetic recording (SMR) method. All these techniques were developed to allow hard disk drives to increase the data density with low cost. To increase data density, more data must be stored in a smaller space. Therefore, the characterization requires the nanoscale resolution offered by MFM mode. Figure 2 shows the different magnetic domain densities achieved by LMR and PMR imaged by MFM mode. The MFM phase on the device recorded by LMR in (a) on a 20 μm by 20 μm scan shows a relatively low domain density. The MFM phase on the PMR sample in (b) on the other hand, resolved a high domain density measured on a 5 μm by 5 μm scan area. Therefore, the MFM measurements clearly showed that PMR achieves a much higher storage density than LMR.
To store data on hard disk media, magnetic domain patterns need to be customized for each application. Figure 3 shows MFM phase images, that resolved different magnetic domain patterns that were written on various positions of the hard disk media surface. Positions 1 and 2, measured with 20 μm by 20 μm scan size, feature a low domain density in the MFM phase. The remaining 7 positions were measured with 5 μm by 5 μm scan size and exhibit an increased domain density. We found a variety of different arrangements for the domain patterns. The MFM phase image of position 5, 6 and 9 exhibited a pixalated pattern whereas position 8 featured periodic stripe domains. In contrast, position 4 and 7 exhibited disordered domain patterns. Therefore, these MFM measurements highlight the various possibilities of domain arrangements and density on the same sample.
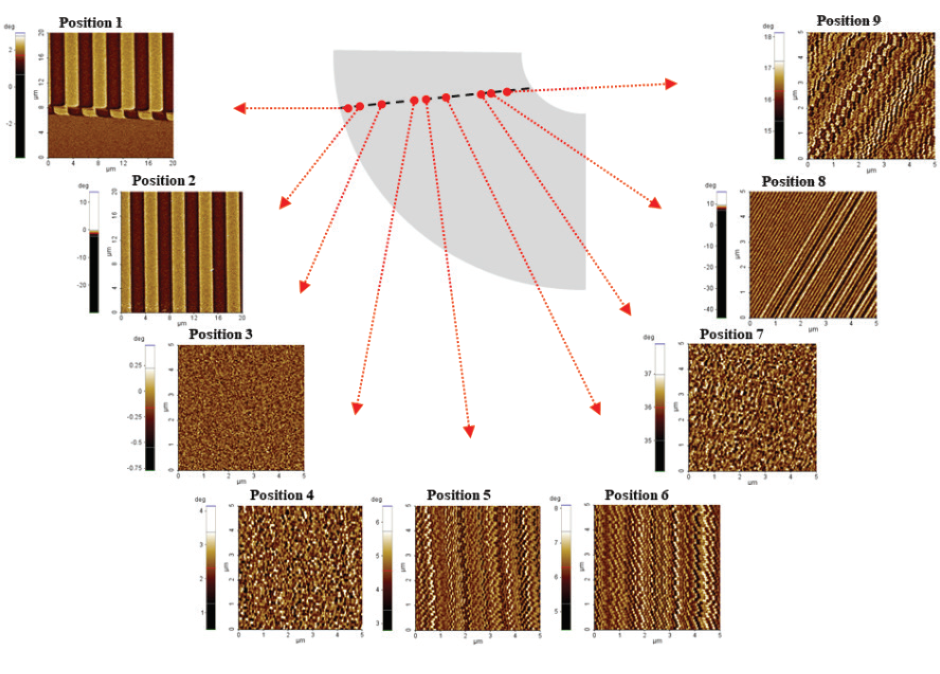
Figure 3. MFM phase images of on the surface of a hard disk that featured a variety of different domain structures and densities. Position 1 and 2 were imaged with a 20 μm by 20 μm scan size, the rest with a 5 μm by 5 μm scan size.
Figure 4 shows an MFM measurement on ferritic–austenitic duplex stainless steels, which have a two-phase microstructure that consists of a balanced fraction of ferrite and austenite. Ferritic-austenitic duplex steels have favorable properties compared to pure ferrite or austenite phases based steels. Duplex steels have a higher strength than austenitic steels, higher impact value than ferritic steels, increased resistance against general corrosion and better thermal conductivity than austenitic steels. The ratio of a 50:50 ferrite:austenite is ideal for duplex steel microstructure. Equal proportions of ferrite and austenite result in optimal mechanical and corrosion properties. MFM phase images can be used to study the ratio of ferrite and austenite as shown in figure 4. While the AFM topography in (a) features only a weak contrast, the MFM phase in (b) shows a distinct material contrast on the surface of the duplex steal. As such the austenite phase can be recognized as bright and uniform contrast in the phase image, the ferrite phase features its typical patterned MFM contrast.
Besides standard MFM imaging, Park AFMs offer the possibility to apply an external magnetic field to change the magnetic state of the sample, via a magnetic field generator (MFG) as an optional feature. Figure 5 summarizes MFM measurements using the MFG to change the magnetic domain distribution on an yttrium iron garnet (YIG) surface by applying an external in-plane magnetic field from 0 Gauss to 270 Gauss. While the sample topography in (a) remained unchanged, the MFM phase images in (b) to (d) captured the modifications to the magnetic domain pattern for different external inplane field strengths. Here, the previously random domain pattern at 0 G in (b) gradually becomes more ordered until the domains arrange in a periodic striped structure at 270 G in (d).
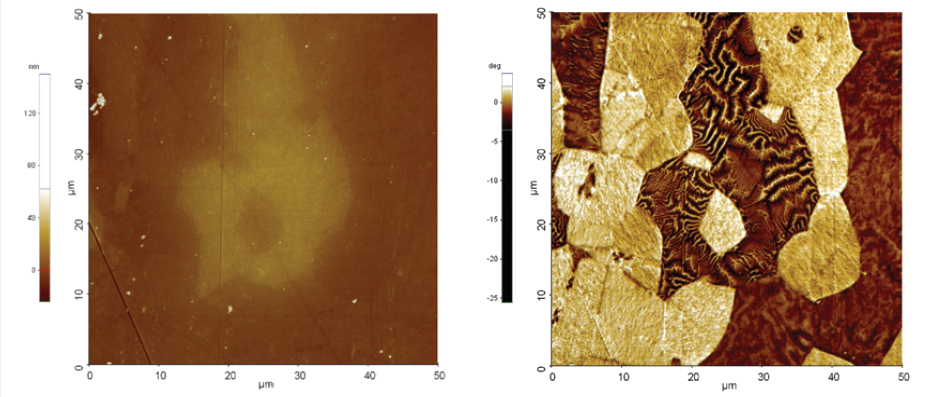
Figure 4. MFM measurement on a ferritic–austenitic duplex stainless steels to characterize the mixing behavior and distribution of the two materials. (a) AFM height with a weak contrast and (b) MFM phase with a distinct material contrast on the austenite and ferrite phases. Scan size was 50 μm by 50 μm.
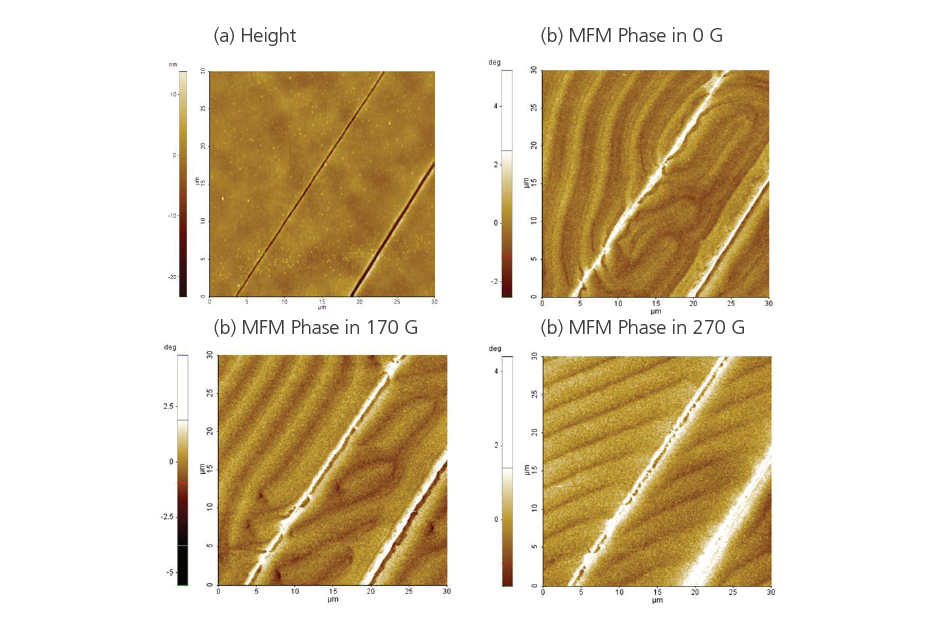
Figure 5. MFM measurements on the surface of an yttrium iron garnet (YIG) sample at varying external magnetic field strengths applied in-plane via Park’s magnetic field generator. (a) AFM height with only a weak contrast, (b) MFM phase without external magnetic field, (c) MFM phase with 170 Gauss and (d) 270 Gauss.