Lisa M. Mey-Ami, Jinjin Wang and Fuhe Li Air Liquide Electronics - Balazs NanoAnalysis, Fremont, CA USA
Dr. Lisa Milstein Mey-Ami is a senior scientist and technical community leader at Air Liquide Balazs in Fremont, CA. Her specialties include trace element analysis of advanced materials, thin films and single nanoparticle analysis by ICP-MS. Prior to joining Air Liquide Balazs in 2007 she worked as a research chemist at RTI International in Durham, NC. She received her Ph.D. in analytical chemistry from the University of Cincinnati.
Nanoparticles are defined as ultrafine particles with at least one dimension in the nano-scale (1-100nm) range. Naturally occurring nanoparticles, present as unwanted contaminants in all aspects of the semiconductor manufacturing processes, are increasingly important to characterize. As the world of electronics become smaller approaching 5 nm technical node, nanoparticles are crucial contaminants that need to be monitored and then removed from the processes to avoid device failure.
This paper describes single particle inductively coupled plasma-mass spectrometry (SP ICP-MS). With the technique, we have evaluated ultrapure water (UPW), process chemicals and the surface of various original equipment manufacturer (OEM) parts. Figures of merit presented include particle concentration (particles/mL or particles/ cm2), median particle size (nm), size distribution, and background equivalent diameter (BED). BED is related to the smallest particle size that can be detected and often as low as single digit nm.
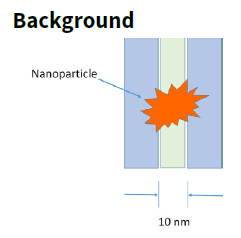
Figure 1: Nanoparticle Studies: Why Needed? Single nm -100 nm particles are now critical. Monitoring & controlling single near 1 nm particles will soon be required.
Figure 1 illustrates the importance of currently being able to detect particles between single nm and 100 nm as sub 10-nm scale devices have been in production since 2018. Soon it will be necessary to monitor near 1 nm particles as the semiconductor technical node continues to scale down.
ICP-MS is routinely used for the determination of trace elements in UPW, process chemicals and extraction solutions for OEM tool parts 1-3. The detection limits are often as low as sub parts per trillion (ppt). Since the analytes dissolve completely and aspirate into the ICP plasma continuously, producing a constant signal intensity, only total elemental concentration is determined. Using time resolved data acquisition with short dwell times (a data point is collected every 0.1 ms), the transient signal of each individual nanoparticle can be differentiated from the steady-state ICP-MS signal generated by the dissolved species. This unique feature, coupled with the assumption of spherical particle size, enables ICP-MS to characterize nanoparticles down to single nm sizes producing various results: particle concentration, particle median size, size distribution information, elemental composition and background equivalent diameter (BED). There is no other analytical methods to date, which can provide all these parameters simultaneously for nanoparticles.
In order to validate that SP ICP-MS is suitable and reliable for the analysis of nanoparticles, a nanoparticle standard with a known size and particle concentration was prepared and studied.
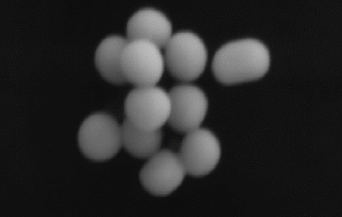
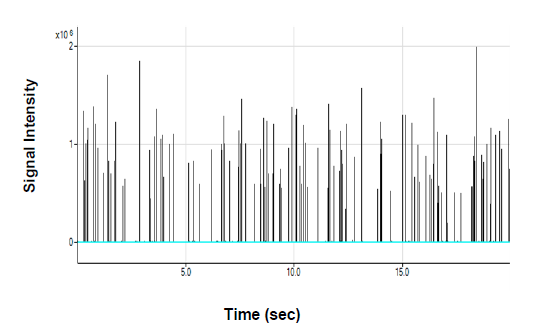
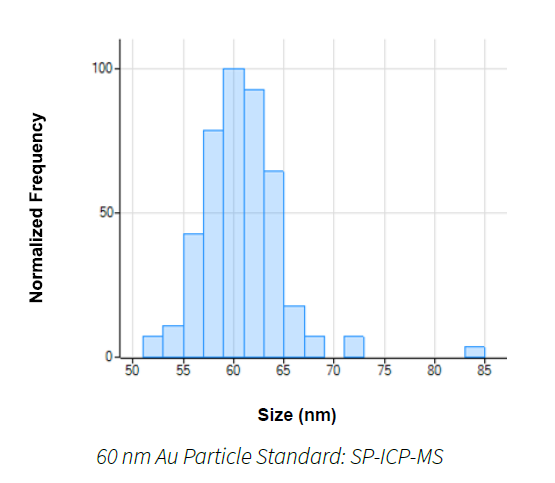
Figure 2: Au (60nm) NP Standard SEM image
Figure 2 shows a scanning electron microscope (SEM) image of a60 nm commercial Gold (Au) nanoparticle standard. Figures 3 and 4 show the time-resolved particle signal profile and the particle size distribution of the Au standard by SP ICP-MS, respectively. As can be seen, the particle size distribution clearly shows that the median Au particle size is centered at 60 nm with a narrow distribution.
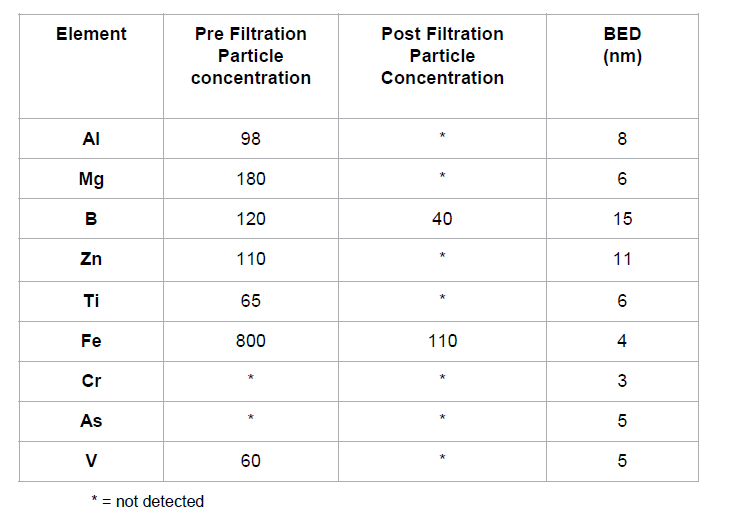
Table 1: Results of a UPW Sample in Particles/mL
Table 1 shows SPICP-MS results for a UPW sample, pre and post 10 nm in line filtration. The samples were analyzed for a variety of elements that commonly form nanoparticles in an aqueous solution and also critical to semiconductor manufacturing. The ICPMS instrument parameters (e.g. reaction gases) were optimized to combat the molecular and isobaric interferences associated with ICP-MS (e.g. 56Fe vs 40Ar16O). Many of the element’s BED values were single nm as the result of the optimization. The analysis revealed that the nanoparticles found in the “pre” sample were successfully removed by the 10 nm inline filter employed. The results demonstrate the effectiveness of SP ICPMS for monitoring nanoparticle filtration efficiency.
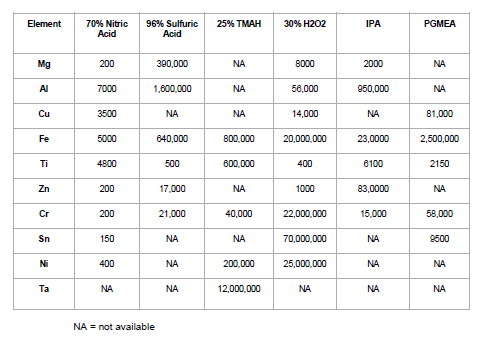
Table 2: Results of Various Chemical Samples in Particles/mL
SP ICP-MS has also been used to characterize various process chemicals. Table 2 shows SPICP-MS nanoparticle concentrations for various analytes in acid samples (e.g. 70% nitric acid and 96% sulfuric acid), base samples: (e.g. 25% tetramethylammonium hydroxide; TMAH), oxidizers: (e.g. 30% hydrogen peroxide; H2O2), and organic solvents: (e.g. isopropyl alcohol; IPA and propylene glycol methyl ether acetate, PGMEA). These are all common processchemicals used in semiconductor manufacturing processes such as cleaning, developing, etching, planarizing and photoresist stripping. Again, ICP-MS parameters were optimized to eliminate interferences (e.g.48Ti vs 32S16O in a sulfuric acid matrix) and enhance overall analysis sensitivity. A large amount of nanoparticles was found in the process chemicals, although the elemental composition of nanoparticles varied. Some of the nanoparticle contaminants were likely introduced during the chemical manufacturing process. For example, Tantalum (Ta) nanoparticles found in TMAH were the direct result from using Ta electrodes in the electrochemical synthesis of TMAH. The Tin (Sn) nanoparticles found in H2O2 were due to the addition of an inorganic Sn-based stabilizer. The decomposition of the Sn compound caused the formation of Tin nanoparticles in H2O2. The precision of SP ICP-MS analysis was studied and the relative standard deviation (RSD) was found to be approximately +/-10%, depending on the element. The consistency of the results have enabled process engineers to develop nanoparticle specifications in order to achieve quality control of incoming process chemicals. Furthermore, material suppliers can use the results to guide their efforts in reducing and removing nanoparticles from various chemicals they produce. Monitoring nanoparticles on a solid part surface is a more challenging task. There hasn't been a suitable technique thus far. Water extracts of OEM parts used in etching and deposition chambers (quartz part, ceramic part and Aluminum coupon) were evaluated for nanoparticles by SPICPMS. Figure 5 shows SP ICP-MS concentration results for a variety of analytes for these three parts expressed in particles/cm2 (surface area).
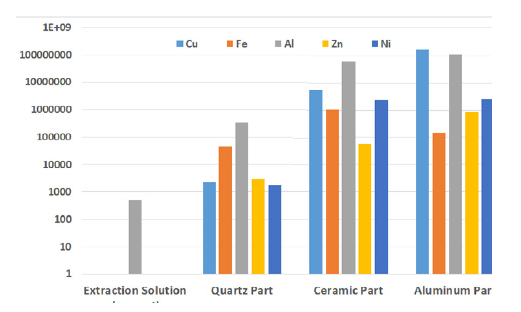
Figure 5: Nanoparticles Found From the Surface of Various OEM Parts in Particles/cm2
SPICP-MS methods have been developed in our laboratory and regularly applied to water, chemicals and OEM parts used throughout semiconductor manufacturing processes. The processes include wafer surface cleaning and preparation, chemical mechanical planarization (CMP), deposition, etching, implantation, and lithography. The analytical results produced have been used by chipmakers, OEM’s and raw material suppliers in monitoring nanoparticles in their processes. The results we obtained showed that a large number of nanoparticles was present in various process chemicals and on the surface of OEM plasma etch and deposition equipment parts. The presence of these nanoparticle contaminantscan cause random device defects and would have a detrimental impact on current and next generation semiconductor manufacturing. A strategy needs to be in place soon to begin reducing the number of nanoparticlesin the process before the semiconductor manufacturing yield can be improved markedly.
The authors would like to thank Dr. Amir Tavakoli and Ms. Laura Jackson for their contributions.
1) Mey-Ami, L., Wang, J., Gotts, H and Li, F., “Single Nanoparticle ICP-MS Analysis of Process Chemicals and UPW Used in Surface Cleaning and Preparation”, Proceedings of International Surface Preparation and Cleaning Conference (SPCC), Cambridge, MA, April 2018.
2) Mey-Ami, L., Wang, J and Li, F., “Optimization of Single Nanoparticle ICPMS Analysis for Controlling Nanoparticles in Process Chemicals and UPW used in Wet Surface Cleaning,” Proceedings of International Surface Preparation and Cleaning Conference (SPCC), Portland OR, April 2019.
3) Wang J., Mey-Ami, L. and Li, F., “A Novel ICP-MS Metrology for Analysis of Nanoparticles in UPW”, Ultrapure Micro, Phoenix, AZ, June 2019