


Cell to Cell Interactive Adhesion Force: C6 cell
Brian Choi, Bio-application scientist
For more information, please contact app@parksystems.com
Sample courtesy: Prof. Tong-mook Kang, Sungkyunkwan Univ)
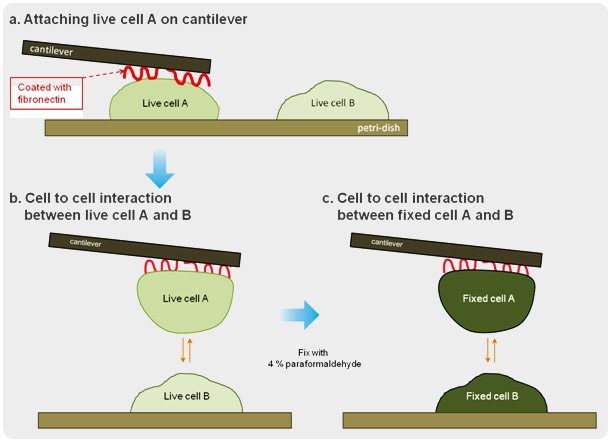
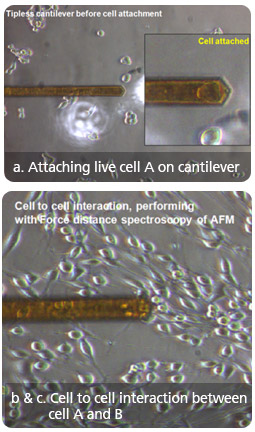
Cells communicate with each other, forming single or multiple interactions to various protrusive molecules and cell junctions. The cell to cell interactions play a crucial role in the development and function of multicellular organisms. With the use of force distance spectroscopy of atomic force microscopy (AFM), the strength of this interaction at the level of individual molecules can be measured under physiological conditions. In this study, one cell attached on a tipless cantilever was brought to the other cell where physical contact between the two was made and force distance spectroscopy was performed.
- Study the cell to cell interaction at the level of individual molecules by detecting the adhesion force with the force distance spectroscopy of AFM.
- Adhesion force of live cell membrane molecules is detectable at sub-nanonewton range and distinctively comparable with inactive molecule.
Steps for Cell to Cell Interactive Adhesion Force Detection
Cell to Cell Interactive Adhesion Force : Live cell vs. Fixed cell
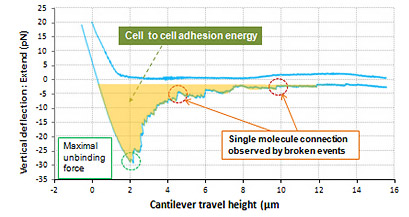 Live cell to cell Adhesion Force
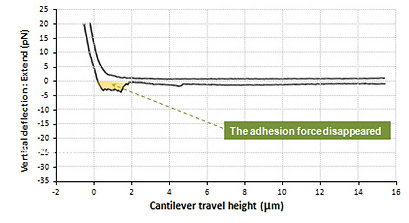 Fixed cell to cell Adhesion Force
Shown above is the interaction between live cell and fixed cell. It was detected that the interaction of live cells generated a certain amount of adhesion energy (colored with orange). The maximum unbinding force of interactive molecules is approximately 27 pN. And many single molecule broken events are detected at the force range of a few piconewton. On the contrary, such cell to cell interactive adhesion force disappeared in the result measured in fixed cells.
Park Cell Analysis Systems
|
|
|
|
| Park NX12-Bio | Park NX10 | Park XE7 | |
| Scanning Ion Conductance Microscopy (SICM) | |||
| Atomic Force Microscopy (AFM) with liquid probe hand | |||
| Inverted Optical Microscopy (IOM) | |||
| Live Cell Chamber |
Quantitative Mechanical Property Imaging by PinPoint modes™: MRC5
Brian Choi, Bio-application scientist
For more information, please contact app@parksystems.com
To study cell at fundamental level, cell’s physical properties (morphology and stiffness/elasticity/adhesion force) must be measured accurately.

- Analyze cell at fundamental level, by acquiring cell morphology and quantitative mechanical property image of cell simultaneously
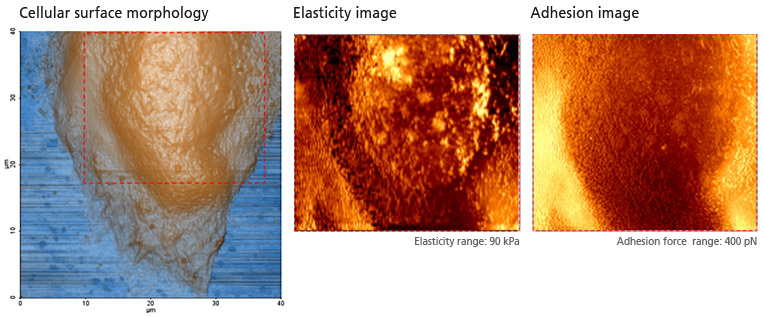
- PinPoint™ mode allows users to visualize elasticity (Young’s modulus) and adhesion force as an image providing quantitatively calculated values
PinPoint mode™ is a newly developed AFM imaging mode that acquires topographical data and the FD data at each pixel simultaneously. Using PinPoint™ mode, cell morphology and the quantitative nanomechanical properties of cell can be obtained at the same time. The height information constituting the morphology of the sample surface is determined when the designated stiffness threshold is reached. The elasticity (stiffness) at certain positions of the sample surface can be obtained the same way as in the FD spectroscopy. The stiffness can be obtained from the slope of FD curve from contact point to deflection threshold generated during the PinPoint mode™ operation. Applying Hertz model, designed for soft and elastic samples, the user can calculate the elasticity (Young's modulus) from the slope, too. The adhesion image is generated based on the maximum adhesion force value.
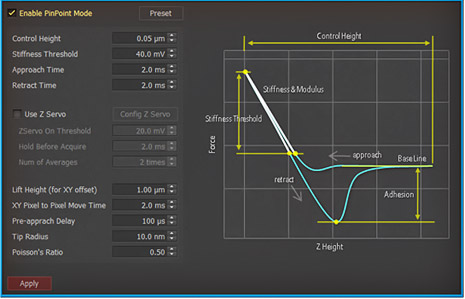 PinPoint™ mode Control
Cell Mechanical Property Study with PinPoint™ mode
Park Cell Analysis Systems
|
|
|
|
|
| Park NX12-Bio | Park NX10 | Park XE7 | |
| Scanning Ion Conductance Microscopy (SICM) | |||
| Atomic Force Microscopy (AFM) with liquid probe hand | |||
| Inverted Optical Microscopy (IOM) | |||
| Live Cell Chamber |
Cadherin Bonds Adhesion Force: Myofibroblast
Brian Choi, Bio-application scientist
For more information, please contact app@parksystems.com
Reference: Philippe Pittet, et al. (2008),
Fibrogenic fibroblasts increase intercellular adhesion strength by reinforcing individual OB-cadherin bonds,
Journal of Cell Science 121, 877-886 (2008)
Cell adhesion molecules play important roles in cell-to-cell communication where cells work together to perform vital physiology processes. Cadherin is one typical protein that acts as cell adhesion molecules, forming adherens junctions to bind cells within tissues together. Force-distance spectroscopy, operating in atomic force microscopy (AFM), is useful to analyze the adhesion molecule interaction quantitatively at the single/multiple molecule level in nanonewton scale.
- Study the cell communication processes at fundamental level by measuring the adhesion force with force distance spectroscopy of AFM
- Cell grown tipless cantilever enables researchers to accurately acquire a large amount of cadherin adhesion force curves
- Cadherin bonds can be identified in the membrane of live myofibroblast
Cell Grown Tipless Triangular Cantilever
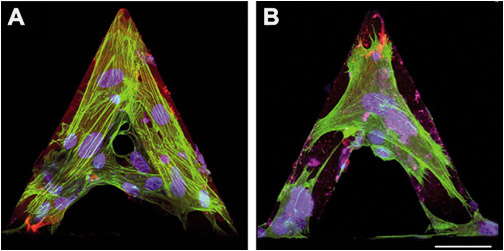
Differentiated myofibroblasts were grown on tipless AFM cantilevers in control conditions (A) or treated for 30 minutes with 1 μM cytochalasin D to depolymerize F-actin (B). Cells were immunostained for α-SMA (green) and nuclei (blue) then images were taken with a confocal microscope.
Cadherin bonds’ adhesion force detection experiment with aFM
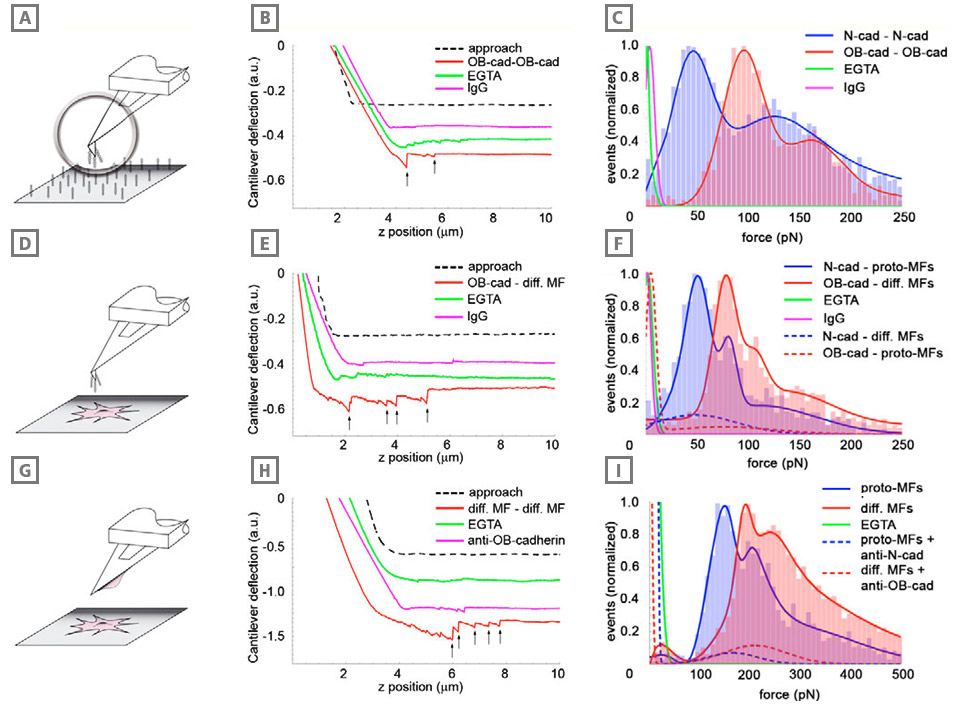
Adhesion of differentiated myofibroblasts is stronger than that of the proto-myofibroblasts. Adhesion forces were measured with AFM between cadherin dimer-coated cantilevers and similarly coated substrates (A-C), between cadherin dimer-coated cantilevers and myofibroblasts (D-F), and between myofibroblasts grown on cantilevers and myofibroblasts grown in monolayers (G-I). In all conditions, cantilever approach-retraction velocities were set to 0.1 μm/second, loading force to 3 nN and contact time to 2 seconds. Typical force-distance curves (B,E,H) under different conditions are displayed for each configuration; arrows indicate positions where bond rupture occurs in a ‘jump’. Red profiles indicate the typical interaction between OB-cadherins (osteoblast) or the differentiated myofibroblasts in the different set-ups, green lines represent the controls in the absence of extracellular Ca2+ (EGTA) and pink lines show the controls performed with Immunoglobulin (IgG)-coated cantilevers (B,E) or contacts formed in the presence of OB-cadherin-blocking peptides (H). Rupture forces (C,F,I) displayed as histograms (n ≥5000 in each condition) were normalized for the total number of rupture events in every configuration and were fitted with Gaussian curves. Results obtained with proto-myofibroblasts and Ncadherin (neural) are displayed in blue, whereas the results for differentiated myofibroblasts and OB-cadherin rupture forces are indicated in red. Note the different scale in H that allowed the significantly higher bond strength in the cell-cell set-up compared with the set-ups in B and E. Cadherin specificity of interactions was controlled by coating the cantilevers with human IgG (C,F, pink), by using EGTA (green) and by applying anticadherin peptides (I, dashed lines).
Park Cell Analysis Systems
|
|
|
|
|
| Park NX12-Bio | Park NX10 | Park XE7 | |
| Scanning Ion Conductance Microscopy (SICM) | |||
| Atomic Force Microscopy (AFM) with liquid probe hand | |||
| Inverted Optical Microscopy (IOM) | |||
| Live Cell Chamber |
Young’s Modulus Measurement (Nucleus vs. Cell body): C2C12
Brian Choi, Bio-application scientist
For more information, please contact app@parksystems.com
Cell has different mechanical property depending on the physiological processes (cell differentiation, growth, adhesion, etc.) and under various pathogenesis (oxidative stress, virus infection, parasites, etc.). Force distance spectroscopy of atomic force microscope (AFM) allows the cell’s mechanical property analysis on the surface at nano-level, and subsurface layers of cells by probing the cell membrane with high resolution cantilever tip (<10 nm). Recording the force value and vertical deflection of the cantilever, the force value versus distance graph (force-distance curve) can be acquired between the probe and the surface. Analyzing the force-distance curve with the Hertz model, the cell’s mechanical property can be calculated quantitatively.
- Analyze the cell’s mechanical property on the surface at nano-level with force-distance spectroscopy of atomic force microscope (AFM)
- Acquire the quantitative mechanical property of cell, by calculating Young’s modulus of cell with the Hertz model
Single Cell (C2C12) Young’s Modulus Measurement: Nucleus vs. Cell body
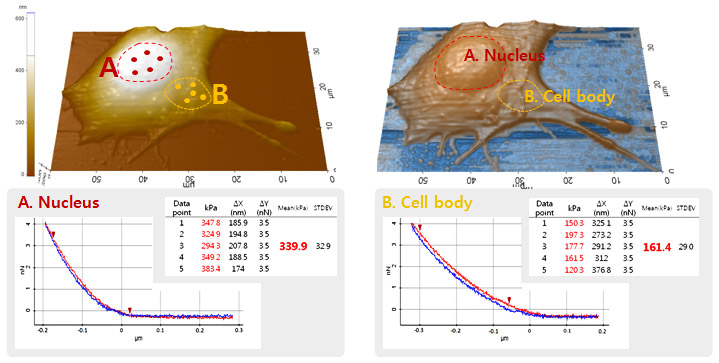
In this study, the quantitative mechanical properties at two different area (nucleus and cell body) of C2C12 cell were acquired by applying the acquired five force-distance curves from each area into the Hertz model. The high resolution AFM imaging of cell allows the determination of the probing position of cantilever tip accurately. The Young’s modulus of cell was determined at the point where the cantilever deflection reached 3.5 nN in each force-distance curve. In nucleus, the Young’s modulus was calculated to be 339.9 kPa (± 32.9) while the result from the cell body was 161.4 kPa (±29.0). It is obvious that at the nucleus area, the mechanical property of cell is about two times bigger or to say that it’s two times stiffer than at the cell body.
Park Cell Analysis Systems
|
|
|
|
|
| Park NX12-Bio | Park NX10 | Park XE7 | |
| Scanning Ion Conductance Microscopy (SICM) | |||
| Atomic Force Microscopy (AFM) with liquid probe hand | |||
| Inverted Optical Microscopy (IOM) | |||
| Live Cell Chamber |
Stiffness of Muscle Fiber: Muscle cell
Brian Choi, Bio-application scientist
For more information, please contact app@parksystems.com
Reference: Noemi Rozlosnik, et al. (2006), Nanomechanics of Single Muscle Fibers by AFM,
International Nano-Conference(ICN+T), Basel (CH)
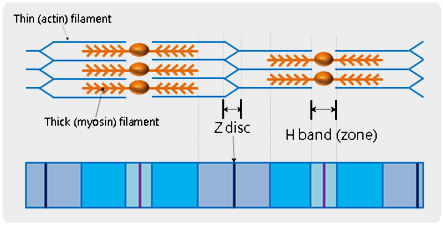
Muscle fiber is composed of skeletal muscle, organized with multi-nucleated muscle cells or myofibers. All individual muscle fibers are arranged into bundles and then finally forms the muscle belly. The basic unit of muscle fiber is called, a ‘sarcomere’ and is defined being between neighbouring Z-discs in a muscle fiber. In the middle of a sarcomere, there is a paler region called the ‘H-band (zone)’ in which muscle relaxation and contraction occur. Utilizing atomic force microscopy (AFM) and its force distance spectroscopy, it is possible to study the mechanical property of the detail units of sarcomere. After identifying a specific feature of biological objects from the high resolution AFM topography, cantilever tip can be brought to the feature and indent it in accurate force control at nanonewton scale.
- Study the mechanical property of the detailed units of sarcomere using AFM and its force distance spectroscopy.
- AFM topography and XY scanner enables the indentation of the cantilever tip at the desired position on the sarcomere with nanometer precision.
- The stiffness of Z disc and H band are accurately calculated and distinguishable in nanonewton range.
Structure of Muscle Fiber (Sarcomere)
The mechanical property of a sarcomere can be analyzed quantitatively by performing the force distance spectroscopy data wherein the force distance curve is acquired on the muscle fiber. Depending on each indenting positions, the corresponding mechanical property can be varied so that the cantilever deflections are recorded differently. The deflection differences are distinguishable, at nanonewton scale, by calculating the ‘stiffness (the angle of loading curve)’ in the recorded force distance curves.
Muscle Fiber Stiffness Measurement by Force-Distance Spectroscopy of AFM
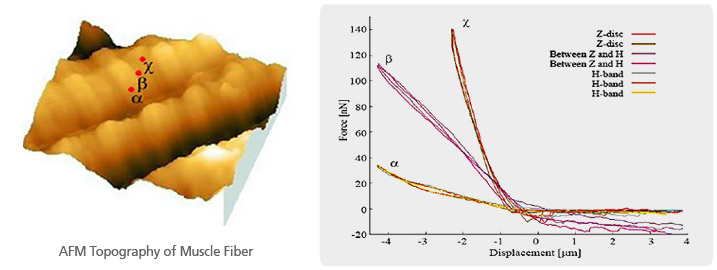
The muscle fiber topography imaged with Park AFM showed the typical morphology of a sarcomere as well as the feature of Z disc and H band. Controlling XY scanner position to one of the sarcomere units, three force distance curves were acquired - H band (α), between H band and Z disc (β), and Z disc (χ). As calculated, the stiffness of H band (α) is about 10 nN/μm, about 45 nN/μm for ‘between H band and Z disc (β)’ and about 110 nN/μm for Z disc (χ). It is obvious that the Z disc (χ) 11 times higher in stiffness than the H band (α).
Park Cell Analysis Systems
|
|
|
|
|
| Park NX12-Bio | Park NX10 | Park XE7 | |
| Scanning Ion Conductance Microscopy (SICM) | |||
| Atomic Force Microscopy (AFM) with liquid probe hand | |||
| Inverted Optical Microscopy (IOM) | |||
| Live Cell Chamber |