


Single molecule interactions analysis using force-distance spectroscopy with functionalized tips
Research Application Technology Center
Introduction
A molecular recognition process refers to the specific binding event between two molecular pair such as receptor-ligand, protein-protein, and protein-glycan. In the terminology, the macromolecule of an interaction is called a “receptor”, and a small molecule binding to its receptor partner produces a biological response is called a “ligand”. The specific interactions and mechanisms of the molecular complexes and effect on biological and physical function enable an understanding of various biological functions such as cell adhesion, genome replication and signaling [1], [2].
A variety of techniques exist to investigate the binding affinity of biomolecular partners, such as surface plasmon resonance (SPR), nuclear magnetic resonance (NMR), optical or fluorescence spectroscopies, and quartz crystal microbalance (QCM) [3], [4]. With the invention of biorecognition detecting techniques, the exploration of the single molecular interactions has become possible, thus providing a deeper insight into biological interactions.
Among single molecule techniques, force-distance spectroscopy, one of Atomic Force Microscopy (AFM) operational modes, is one of the most powerful tools to study biological complexes, allowing to detect intermolecular binding forces with high resolution and sensitivity in physiological conditions [5-8]. AFM is an established technique for obtaining topographic information of sample surfaces with nanometer spatial resolution. AFM also can measure the mechanical properties of the sample with or without labelling or treatments. The force-distance spectroscopy exhibits single pico- or nano-newton force sensitivity, small lateral contact region between tip and sample. These features make it suitable for studying the molecular features in the biorecognition process. In a typical experiment the AFM tip is functionalized by attaching the target molecule to the AFM tip, while the substrate is modified with the target molecule partner. AFM can operate in fluid so the biomolecular interaction such as receptor-ligand, protein-protein and antigen-antibody interaction can be measured under physiological conditions (Figure 1).
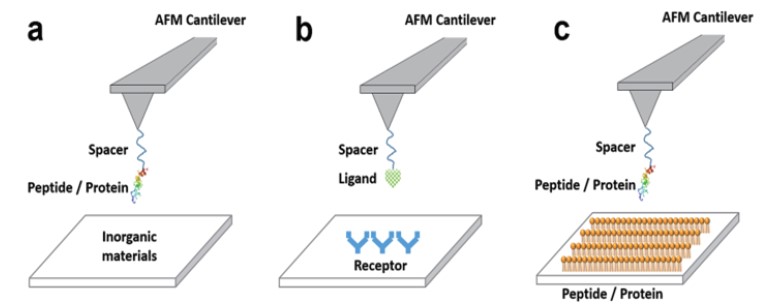
Figure 1. Examples of single molecule force-distance spectroscopy applications for
biorecognition processes. (a) peptide-inorganic materials interactions, (b) receptor-ligand
interactions, (c) peptide-peptide (or protein) interactions.
Force-distance spectroscopy using functionalized AFM tips
AFM tip functionalization – Several methods exist to attach molecules to the AFM tip. The most common approach is formation of amino-self assembled monolayers (SAMs) onto a gold coated AFM tip [9]. The first step of AFM tip functionalization using this method is to employ gold-thiol chemistry. To bind the thiolated molecules to gold-coated AFM tips, alkanethiol molecule with 10 ~ 18 carbon atoms is generally used. These chain lengths can improve hydrogen bonding and stability of binding [10]. After attaching the alkanethiol molecule, the desired ligand molecule can be immobilized directly to the AFM tip. However, in that case, many non specific bindings can be occurred. To avoid it, spacer molecules are used. Polyethylene glycol (PEG) is a commonly used polymer spacer for single molecule interaction analysis. For example, in the case of PEG24, it has length of approximately 9 ~ 10 nm, and through this known length, enables conformation whether the corresponding result is specific or non specific interaction in the force-distance (FD) curve. Since most biological interactions are very weak, it is usually recommended to use an AFM cantilever with a small spring constant (Less than 0.1 N/m).
Force-distance spectroscopy – A FD curve depicts the result of the AFM tip’s interaction with the sample as a function of its distance between the two. To measure the interaction, the AFM tip moves directly towards the sample until a threshold is met and then retracts again.
In typical force-distance spectroscopy, as shown in figure 2, the first step of FD curve measurement is the “approach”. The cantilever is positioned far from the sample surface where no measurable forces are affecting the tip indicated by no cantilever deflection change. Next, the approach curve is displayed by moving the AFM tip towards the sample surface and “contact” (reaching the repulsive regime and hitting as (preset) threshold) between them. After approach, the z-movement of the tip is reversed, yielding in retraction of the tip from the sample surface. During the retract curve, adhesion force between tip and sample are acquired. The last step is the “pull-off” which the distance between tip and sample is so far that it reaches critical point, which means the pulling force on the cantilever overcomes the adhesion forces between tip-sample, so there are no contact between sample and tip.
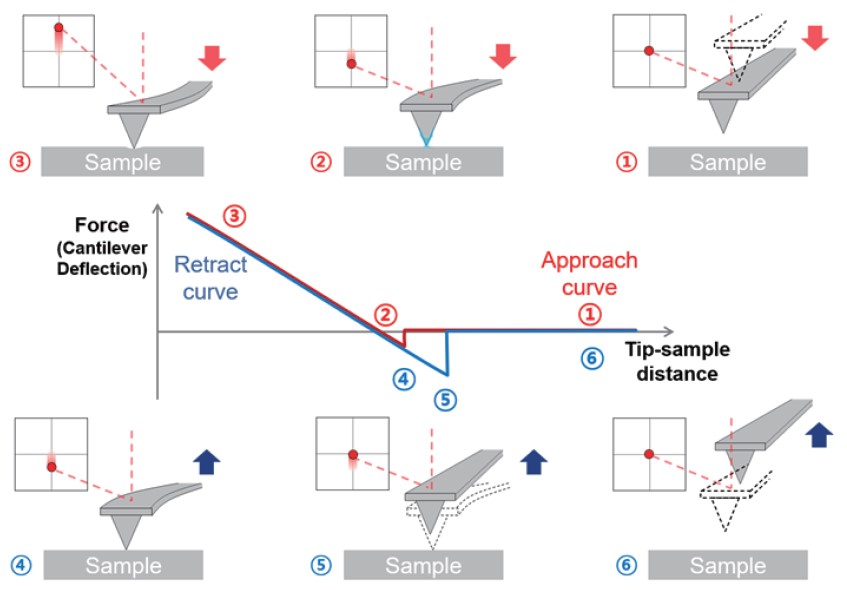
Figure 2. Schematic of Force-distance spectroscopy with FD curve.
Single molecule interaction determines the specificity of interactions between two molecules. In a general receptor-ligand interaction measurement by AFM, the receptor is attached to a sample surface and the ligand attached to the tip end. When the ligand attached AFM tip contacts with the substrate containing receptor, the binding is occurred between them. The tip is then retracted from the surface, fitting with receptor, pulling the ligand out of its binding site. The deflection signal of the cantilever which can calculate to force by the receptor-ligand specific interaction is recorded. Typically, the maximum adhesive force (pull-off) from FD curve is known as the receptor-ligand binding force. Also, rupture length due to the polymer spacer (Generally PEG24, 9 ~ 10 nm length) can be confirmed (Figure 3).
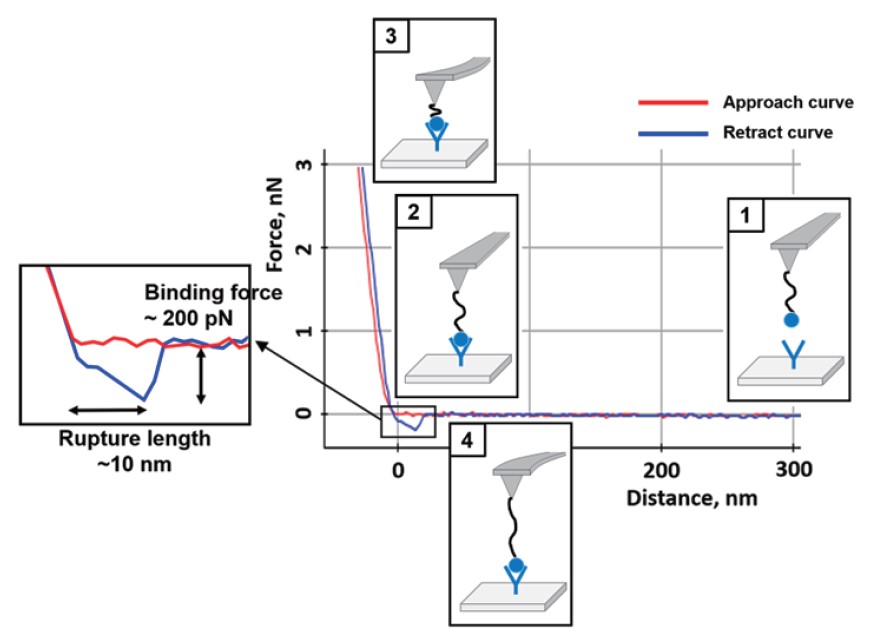
Figure 3. A representative FD curve with AFM functionalized tip.
The curve includes both the binding force (specific interaction)
and the rupture length between two molecules.
Although force-distance spectroscopy can provide a variety of opportunities to determine the single molecule interaction at pico to nanoscale level, still unknown, ambiguous and controversial results have been recorded in different experimental conditions. In this manner, a few issues related to experimental parameters or analysis procedures have to be considered to achieve the reliable and reproducible result.
i. The investigation of single molecule interaction requires that individual biomolecular pair is effectively involved in their interactions. The FD curve shows sometimes very sharp, large or multiple binding events, instead of the desired specific binding. In order to obtain an accurate information of the binding events, a control of functionalization process of both AFM tip and the substrate surface is considered, such as the density of molecule attachment or incubation time.
ii. FD curve results are influenced by the presence of non specific binding force among components of buffer, unexpected molecules and sometimes the desired molecular pairs. Therefore, the establishment of criteria to distinguish between specific and non specific interaction is required at all data-set by determining false positive interaction.
iii. The detailed and proper data interpretation with a number of FD curve results should be considered with statistical analysis. To establish the trustworthy quantitative information, performing many numbers of FD curves and selection of dependable FD curves are required for data analysis. During this process, non specific or strange shape of FD curve has to be removed from data-set.
Cases of FD curves for single molecule interaction analysis
FD curves measured for each type of molecular partners are depicted in Figure 4. Figure 4(a) shows specific binding force between two molecules. In the retract curve, the adhesion force refers to the binding force of two molecules, and it can be confirmed that this binding force occurs when the interaction between the two molecules is broken through the rupture length caused by the spacer. It means the rupture length which calculated from the nonlinear part of the retract curve is expected to almost similar for that of the spacer under stretching. Figure 4(b) shows a no binding event. No have any detectable binding event and no interaction. Figure 4(c) explains double binding event of target molecules. This is not only caused by multi-domain interactions, but also because two molecules of the functionalized AFM tip bind to two partner molecules on the substrate. Figure 4(d) indicates non-specific binding force between the AFM tip and the substrate, likely without the connection of the molecules. In general, the rupture length is not confirmed for non-specific binding forces. In addition, it shows a much larger force value than the specific binding force, and there are various reasons for the non-specific binding force, but it is generally caused by interaction between unexpected materials other than the desired two molecules interaction. Figure 4(e), (f) show the examples of stretching of multiple binding event such as multivalent specific interactions, stretching of the molecules and a few cases of non-specific interactions. In the case of multiple binding, it can be expected as a reaction between two or more molecules rather than an interaction between single molecules, and it may be an unexpected interaction. Multiple stretching can occur when several polymer chains are involved in the reaction. Since the single molecule interaction is an experiment in which various chemicals and biological materials must be handled very carefully, many variables affect the FD curve results. In general, the case of Figure 4(c)-(f) is not the result we want, except for cases where double or multiple interactions have to be checked for special purposes. If double/multiple/non-specific interactions are confirmed only in a few cases, they can be ignored, but if repeated or numerous inappropriate results are obtained continuously, troubleshooting such as tip/sample preparation or adjustment of force-distance spectroscopy parameters is required.
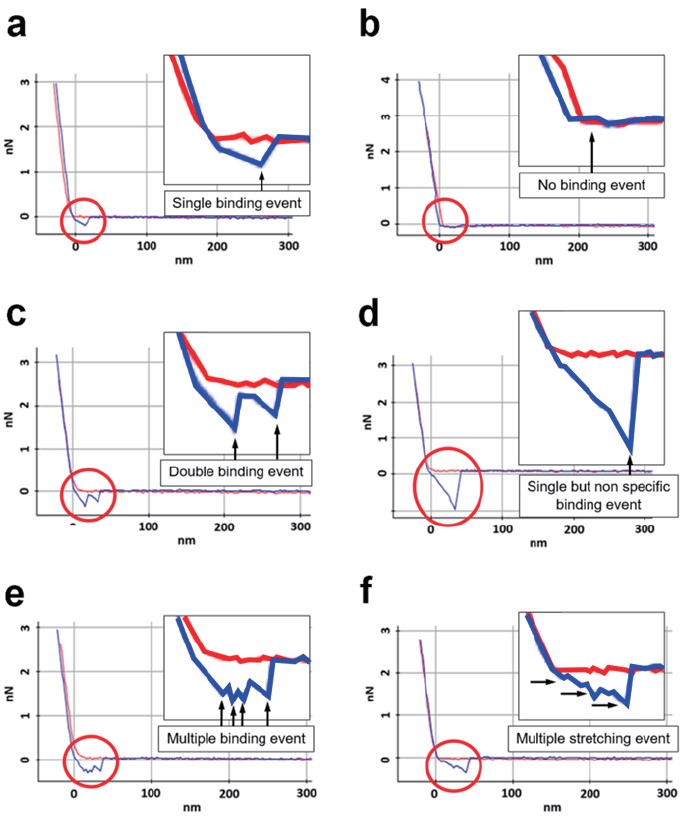
Figure 4. Examples of FD curve for single molecule interaction analysis, red and blue lines indicate approach and retract curves, respectively. Specific binding (a), no interaction (b), double binding (c), non-specific binding (d), multiple binding (e), multiple stretching (f).
Conclusion
In this application note, we discuss an AFM-based approach for single molecule force-distance spectroscopy that can measure the adhesion force associated with specific binding interactions between two molecules forming a ligand-receptor pair. Understanding the interplay of two specific molecules within a bio-complex system plays an important role in studying the corresponding biological functions. Investigating the binding mechanism which governs non-covalent molecular bonding and understanding the strength of biomolecular complexes lead to a fundamental understanding of how the specific species interact with each other and consequently elucidate the biorecognition system which paves the way for future applications and biological or medical research.
References
[1] Dupres, V., Verbelen, C. & Dufrêne, Y. F. Probing molecular recognition sites on biosurfaces using AFM. Biomaterials 28, 2393-2402 (2007).
[2] Ha, T. & Selvin, P. R. Single-molecule techniques: A laboratory manual. (Cold Spring Harbor Laboratory Press, 2008).
[3] Deniz, A. A., Mukhopadhyay, S. & Lemke, E. A. Single-molecule biophysics: at the interface of biology, physics and chemistry. Journal of the Royal Society Interface 5, 15-45 (2008).
[4] Neuman, K. C. & Nagy, A. Single-molecule force spectroscopy: optical tweezers, magnetic tweezers and atomic force microscopy. Nature methods 5, 491 (2008).
[5] Noy, A. Handbook of molecular force spectroscopy. (Springer Science & Business Media, 2007).
[6] Florin, E.-L., Moy, V. T. & Gaub, H. E. Adhesion forces between individual ligand-receptor pairs. Science-AAAS-Weekly Paper Edition-including Guide to Scientific Information 264, 415-417 (1994).
[7] Moy, V. T., Florin, E.-L. & Gaub, H. E. Intermolecular forces and energies between ligands and receptors. Science 266, 257 (1994).
[8] Ebner, A. et al. in STM and AFM Studies on (Bio) Molecular Systems: Unravelling the Nanoworld 29-76 (Springer, 2008).
[9] Hinterdorfer, P., & Dufrêne, Y. F. Detection and localization of single molecular recognition events using atomic force microscopy. Nature methods, 3(5), 347-355 (2006).
[10] Yan, J. & Dong, S. Self-assembly of the pre-formed inclusion complexes between cyclodextrins and alkanethiols on gold electrodes. Journal of Electroanalytical Chemistry 440, 229-238 (1997).