


Characterization of roughness and mechanical properties of a contact lens surface using atomic force microscopy (AFM) with a liquid cell for contact lens
Research Application Technology Center
Abstract
A soft contact lens is mostly used type of contact lens which is made of gel-type material. This slippery and transparent material with a unique curvature like human eye requires cutting, drying or freezing to fix for a surface characterizing. Considered that most contact lens is used in moist environment inside of human eye, these preparations may result in inaccurate research peroration. We introduce a liquid cell for contact lens which can place a soft contact lens without deformation and provide a stable environment for AFM application. As fully immersed in saline solution, surface of a soft contact lens with color coating was scanned by tapping and pinpoint mode and successfully acquired roughness values, Young’s modulus, and adhesion energy of the lens surface with nano-scale resolution.
Introduction
As a replacement for glasses, contact lenses are a commonly used tool for vision correction with benefits such as comfort and convenience. Their application has expanded into the cosmetic market and contact lenses are considered as substitute for invasive surgery. A variety studies have focused on the characteristics and material properties of contact lenses, which have led to a versatility in properties and application fields [1, 2].
Technical reviews on contact lenses often name surface roughness and material analysis as key factors that define the comfort for the customer as well as the resistance against bacterial contamination [3, 4, 5]. High tech manufacturing innovations of the lens mold facilitated lens surfaces with roughness in the nanometer-scale. Lens surface takes on distinctive roughness and surface adhesion features depending on their manufacturing process and the after treatment [6]. These features establish guidelines for commercial use of contact lenses and lead to innovations in research industry. Among commonly used microscopy techniques, AFM is best suited for studying surface properties on the nanometer scale. The ability of AFM for quantitative topography analyzation surpasses any other system; features such as pores or surface defects can be mapped in three dimensions. Using force distance spectroscopy, AFM additionally obtains mechanical properties like surface adhesion and Young’s modulus.
While this versatility is quite useful, the domed shape of a contact lens contrasts with the need for a flat surface in AFM system to obtain useful surface data. Eventually, lenses are cut or deformed in a way to flatten the surface enough to achieve stable measurement conditions. However, the deformation of the lenses for AFM measurements could entail a loss of information on actual mechanical properties. Here, we introduce a liquid cell for a contact lens measurement. This special cell design has a convex structure with a similar curvature to human eye to hold a contact lens without deformation. A cover with a hole in the middle fixes the sample and enables access for the AFM tip. We demonstrate surface roughness measurements using tapping mode as well as the Park Systems’s PinPointTM nanomechanical mode to determine additional properties such as the difference in Young’s modulus and adhesion energy between the center and the color coated layer.
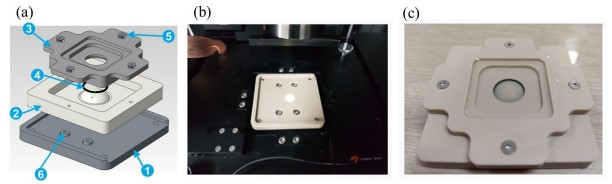
Figure 1.(a) Schematic structure of the liquid cell design for contact lenses, (1) Cell adapter for AFM body (2) Cell Base (3) Cell bracket (4) O-ring between base and bracket (5) 2Ф bolts (6) 2.5Ф bolts. (b) Cell adapter installed on the AFM body (c) Cell base and bracket components connected with soft contact lens inside.
Materials and Methods
Liquid cell for contact lens
The cell design consists of three main parts, the cell adapter, the cell base and the cell bracket (bottom to top in figure 1 (a)). The cell adapter is screwed into AFM body first (Figure 1 (b)), and then the assembled cell is magnetically attached to the adapter. This configuration allows an independent assembly and manipulation of the liquid cell to facilitate an easy preparation of measurement. A dome
Experimental Set-up
To demonstrate the working principle of the cell, we mounted it to an NX12 AFM from Park Systems. We applied saline solution to the cell and fully immersed the contact lens under this solution to maintain the aqueous environment, in which actual usage of the lens mostly occurs. A Biolever Mini (BL-AC40TS) cantilever from Olympus was mounted on the liquid probe hand enabling inliquid tapping and pinpoint modes on the soft contact lenses with color coating. The resonant frequency of the cantilever is 110 kHz in air and 25 kHz in water. We chose the Biolever Mini cantilever with a small spring constant (k = 0.1 N/m) for its softness due to concerns that deformation by the cantilever could change the surface.
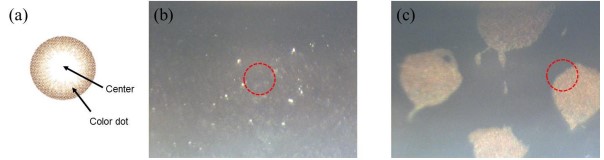
Figure 2. (a) Concept drawing of a soft contact lens with a color layer. (b) Optical camera image: Center of the lens surface on the convex top region and (c) color coated area. The red circles mark the AFM scan areas. The optical image scale for both (b) and (c) is 480 µm × 360 µm.
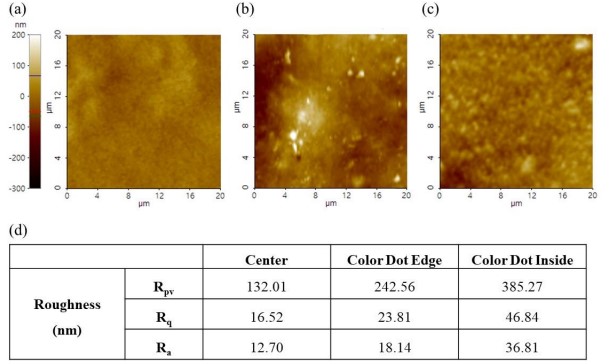
Figure 3. All images are scaled to the same color. (a) Topography result of the center region on the top of the lens. Topography on the edge (b) and inside (c) of the color dot. (d) Peak to valley (Rpv), root mean square roughness (Rq), and average roughness (Ra) chart from (a), (b), and (c).
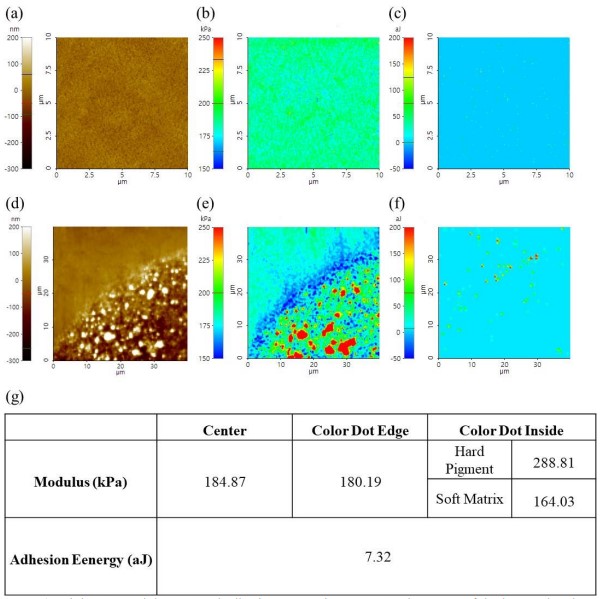
Figure 4. Height (a), modulus (b), and adhesion energy images (c) at the center of the lens and at the color dot region (d), (e) and (f), respectively. (g) Modulus and adhesion energy mean values chart; modulus and adhesion energy values in center is from (b) and (c), modulus of the edge and inside of color pigment were partially analyzed from (e), and adhesion energy for mean value of whole image except some high peaked distinctive points from (f). All images were performed using PinPointTM nanomechanical mode.
Result and Discussion
Using an optical camera with 10× magnification, we examined the sample surface prior to the AFM measurement. The center of this contact lens is transparent and the coating layer covers the rim of the lens as common in colored contact lenses (Figure 2 (a)). Optical images of these two different regions are shown in figure 2; in the center (b) and on the color coated outer ring (c). Each of the optical images are marked with a red dotted circle where the AFM topography was scanned in the following. For the center region of the lens, we simply zoomed into the center of the optical position and scanned a 20 µm × 20 µm region (Figure 3 (a)). Same measurements were conducted on both edge (Figure 3 (b)) and inside (Figure 3 (c)) of the color pigment for comparison.
For analysis, three different roughness values were reported; peak to peak difference between the highest and lowest height value (Rpv), root mean square roughness (Rq) and the average roughness value (Ra).
All three roughness values (Rpv, Rq, and Ra) displayed the same trend, with the smallest roughness values for the center of the lens and highest roughness in the color pigment, respectively. The color coating increased the surface roughness more than two times compared to the center region without coating layer. Furthermore, topography data obtained at the inside of color pigment showed noticeable differences compared to outside of color pigment.
For a comparison of the mechanical properties, we scanned the center of the lens and the edge of the coating with the PinPointTM technique. While the center region showed homogenous roughness and mechanical property characteristics (Figure 4 (a, b, c)), the edge of the color coating clearly indicated a structural change figure 4 (d, e, f). Coating layer edge is scanned for immediate comparison between edge (upper left side region) and inside (bottom right side region) of coating (Figure 4 (e)). As the roughness increases towards the color coating, the mechanical properties reveal that this coating consists of two phases with hard coating pigments embedded in a softer matrix: With respect to the edge of coating, the color pigments are harder and the bottom matrix of the coating is softer.
While these Young’s modulus difference is obvious, this feature does not appear in adhesion energy (Figure 4 (e, f)). There were points with high adhesion energy in figure 4 (f) which were mainly distributed on soft matrix. In these distinctive points, the adhesion energy was 70.48 aJ which was over ten times higher than rest of the image region. Since the tip and sample reaction is acted under saline solution, adhesion energy was not following the regional contrast observed in the modulus image in color pigment images due to the cantilever damping in liquid.
Conclusions
We introduced a liquid cell with a curvature similar to human eye structure. This cell provides a simple and stable measurement environment for soft contact lenses without deforming or destroying the lens and facilitates imaging in saline solution. Roughness measurements were obtained with a high resolution, comparing the color coated layer with the non-coated substrate. We discovered a clear change in topography as well as the Young’s modulus between the two regions of the lens. These results represent a first reference of an AFM study on contact lenses, which can then be used to analyze critical issues such as degradation and bio-fouling. The new innovative cell design will allow the AFM to become a reliable tool in the contact lens industry and revolutionize the way that contact lens can be studied on the nanoscale.
References
1. Carnt, N., Wu, Y., & Stapleton, F. (2017) Contact Lenses, Reference Module in Neuroscience and Biobehavioral Psychology.
2. Furqan A. Maulvi, Tejal G. Soni & Dinesh O. Shah (2016) A review on therapeutic contact lenses for ocular drug delivery, Drug Delivery, 23:8, 3017-3026.
3. Gerda M. Bruinsma, Minie Rustema-Abbing, Joop de Vries, Boudewijn Stegenga, Henny C. van der Mei, Matthijs L. van der Linden, Johanna M. M. Hooymans, and Henk J. Busscher (2002) Influence of Wear and Overwear on Surface Properties of Etafilcon A Contact Lenses and Adhesion of Pseudomonas aeruginosa, Investigative Ophthalmology & Visual Science December 2002, Vol.43, 3646-3653.
4. Maria Jesus Giraldez and Eva Yebra-Pimentel (2012) Hydrogel Contact Lenses Surface Roughness and Bacterial Adhesion, Ocular Diseases, Adedayo Adio, IntechOpen.
5. Ţălu, Ştefan & M., Ţǎlu. (2012) Surface roughness of contact lenses investigated with atomic force microscopy, The Scientific Bulletin of VALAHIA University – MATERIALS and MECHANICS, Romania, no. 7 (year 10), p. 107-110.
6. Jones, Lyndon & Subbaraman, Lakshman & Rogers, R. & Dumbleton, Kathryn. (2006). Surface treatment, wetting and modulus of silicone hydrogels. Optician. 232. 28-34.