


Nanoscale Electrochemistry Study using SECCM Option of Park Systems
Jiali Zhang and Byong Kim
Park Systems Inc., Technical Services, Santa Clara, CA USA
Introduction
The Holy Grail in electrocatalysis and energy storage is to correlate electrochemical activity with nanostructured electrochemical interfaces (electrodes) [1]. However, it is challenging to quantify the heterogeneity of electrode structures or study the local structure-activity relationship for these interfaces using conventional macroscopic electrochemical techniques. This is because macroscopic electrochemical studies can only measure the totalelectron transfer on an entire sample. To solve this issue, a new strategy to characterize nanoscale electrochemical activity is needed.
Scanning electrochemical cell microscopy (SECCM) is a new pipette-based nanoelectrochemical scanning probe technique designed to investigate the local electrochemical properties of electrode surfaces [1-4]. A quasi-reference counter electrode (QRCE) is inserted into the nanopipette, which is filled with an electroactive species. Lowering the nanopipette using the AFM (atomic force microscope) Zscannerand creating a meniscus at the contact surface allows a tiny droplet, or nanoelectrochemical cell, to form. The electroactive species in the confined droplet undergo an electrochemical reaction when a bias is applied between the QRCE and the working electrode placed on the XY scanner. An electrochemical current mapping isextracted by collecting multiple cyclic voltammograms at various positions.
In SECCM, researchers can perform thousands of confined nanoelectrochemical measurements (droplet area ranges from nm2 to µm2) on a single surface [5]. High-throughput experimentation is achievable. Researchers can easily alter the chemical systems by merelyswapping a new pipette withanother electroactive species, and there is little need for special preparation of samples. Pipette preparationisstraightforward and cost-effective. The data is easy to interpret; a higher current represents a higher rate or electrochemical reaction in the probed region. All of the above advantages make SECCM the suitable solution forelectrochemical interrogation of individual platinum nanoparticles[3] or for correlation of local electrocatalytic activities with the local structures on polycrystalline electrode surfaces [5-6].
In this study, the electrochemically reversible [Ru(NH3)6]3+/2+ redox process at a highly-ordered pyrolytic graphite (HOPG) surface is recorded using Park NX12 AFM system. All Park NX systems can be the platform for SECCM. A glass nanopipette with a Ag/AgCl QRCE is utilized.Using previous successful experience in commercialized pipette-based electrochemical microscopy [7], Park Systems’s hardware and software enable localized nanoscopic cyclic voltammetry measurements each time the meniscus contacts the surface. Thus, Park NX12 produces a spatially-resolved surface electroactivity mapping of HOPG with high-throughput at the micro- and nanoscale.
This work demonstrates the effectiveness of Park Systems’s commercial SECCM option for quantitative electroanalysis at the nanoscale. This capability could also facilitate the rational design of functional electromaterials with potential applications in energy storage (battery) studies and corrosion research.
Experimental
Potassium chloride (KCl, Sigma-Aldrich) and hexaammineruthenium (III) chloride ([Ru(NH3)6]Cl3, Sigma-Aldrich) are used without modification. 0.0155 g [Ru(NH3)6]Cl3 and 0.037 g KCl are dissolved together in 10 mL deionized (DI) water to prepare the mixed electrolyte solution with a concentration of 5 mM [Ru(NH3)6]Cl3 and 50 mM KCl. The highly-ordered pyrolytic graphite (HOPG) sample is the working electrode that was cleaved using the “scotch tape method” before usage [8].
For all SECCMexperiments in the Park NX12 system,decoupled XY and Z piezoelectric scanners control the pipette and sample movement. The SECCM experiments are conducted using Park Systems SmartScanTM software. Figure 1 depicts the schematic diagram of the SECCM. A glass nanopipette with a ∼100 nm-diameter tip opening, fabricated by pulling a borosilicatecapillary, is first filled with an aqueous electrolyte solution (5 mM [Ru(NH3)6]Cl3 +50 mM KCl). Then an Ag/AgCl electrodeis inserted in the pipette to serve as theQRCE. Next, the electrolyte-filled pipette is fixed on the Park SICM head and positioned above the HOPG electrode surface. The SICM head contains a current amplifier, which is assembled onto the Park NX12 system for current measurement.
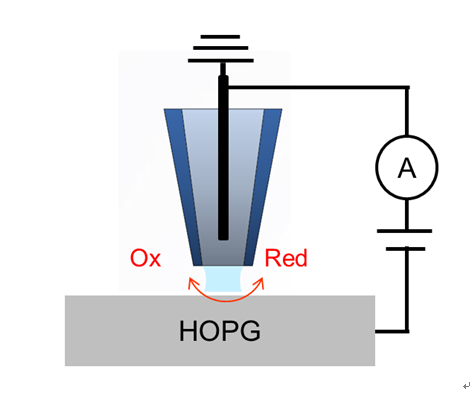
Figure 1.Schematic illustration of SECCM configuration with a single channel pipette.
The SECCM mode consists of five windows and panels that allow the operator to control the nanoelectrochemical process (Figure 2). In the first step, a liquid meniscus formsas the pipette approaches the sample, which behaves as a nanoscale electrochemical cell. Using the vision view, the operator can check the distance from the tip end to the sample surface (Figure 2A). During the approach, a potential bias of (-0.5V) is applied to the sample surface. The current log channel records the current across the meniscus (Figure 2B). Changes in this current serve as signals to control the Z scanner movement until a meniscus forms without contacting the substrate.When the probe meniscus contactsthe surface, the Z scanner stops, and a reduction reaction happens withinthe confined droplet at the predesignated potential [9]. Thus, thecurrent at pA range is detected by comparing it to the background fA current in the air. The current log channel in Figure 2B indicated that this sudden current change generated a current spike. This refers to the change in current versus time in the current log file when the meniscus forms and a reduction reaction happens.
After the pipette contacts the droplet, the operator can measure the electrochemical activity at the designated position using I/V spectroscopy mode to obtain a single linear, cyclic voltammogram. In the control panel (Figure 2C), the operator can inputthe desired experiment conditions, including sample bias voltage, sweep rate/speed, cyclerepetitions, and output channels. The cyclic voltammograms (CVs) for the Ru (NH3)6]3+/2+ redox reaction arerun on the HOPG surface at various scan rates by applying a sample bias voltage ranging from -0.5 V to 0 V. In the Position area (Figure 2D), the operator can use the “Point List” function to assign the location forthe single CV curve to be obtained. The “Point Grid” functionallows the operator to obtain the I/V spectroscopy repeatedly across a predetermined surface and create an image of the electrochemical activity. This function is referred to as the Approach-Retract-Scanning (ARS) mode [10]. As the pipette lands at various predefined grid positions using AFM, linear CVs are recorded upon each meniscus forming. Finally, the obtained CV will appear in the “Data View” panel (Figure 2E).
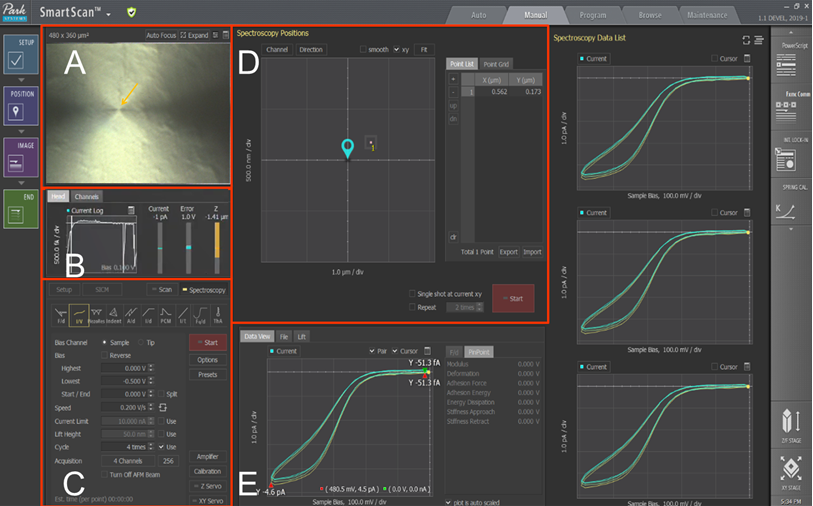
Figure 2.SECCM Mode in Park SmartScanTM software. (A) Vision & Monitoring view. (B) Current monitor panel. (C) I/V spectroscopy parameter control panel. (D)Spectroscopy positions control panel for point list or point grid function. (E) Data viewing panel.
Results and Discussion
In our SECCM experiments, a glass nanopipette with a ∼100 nm-diameter tip opening filled with 5 mM [Ru(NH3)6]Cl3is mounted on the SICM head positioned above the HOPG electrode surface. Once the meniscus forms, a linear sweep voltammetry (LSV) is used to record the localized electrochemical activity across the HOPG surface. To acquire the microscopic understanding of the [Ru (NH3)6]3+/2+ electron transfer process on HOPG, an LSV is recorded in the range 0V→-0.5V → 0V. The bulk macroscopical Ru (NH3)6]3+/2+ redox reaction CV curve determined this bias range. Figure 3 shows a typical SECCM LSV curve for the reduction of (NH3)6]3+. The smooth sigmoidal wave shape observed is characteristic of the LSV acquired in SECCM format [11]. This sigmoidal plot corresponds to a quasi-steady-state voltammogram, and the steady-state limit current is about -5.3 pA with a sample voltage of-0.5 V. The small current magnitude detected demonstrates the power of Park Systems’ low-noise current detector. The redox reaction is reversible. When the potential sweeps from 0V to – 0.5 V, the [Ru(NH3)6]3+reduction occurs, and when the potential sweeps back to 0 V from -0.5 V, oxidation happens.
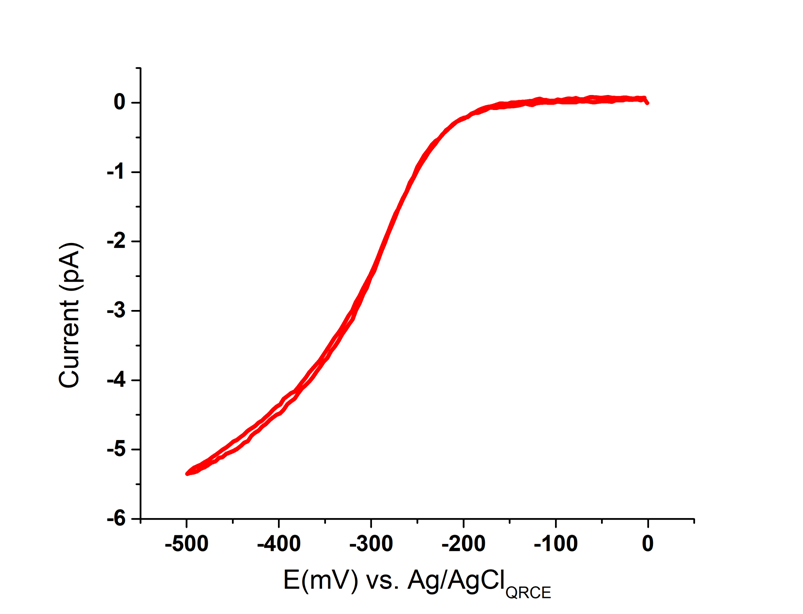
Figure 3.Single SECCM LSV acquired with a glass nanopipette filled with 5 mM [Ru(NH3)6]Cl3. The LSV is recorded at a sweep rate of 10 mV/swith an initial potential at 0 V.
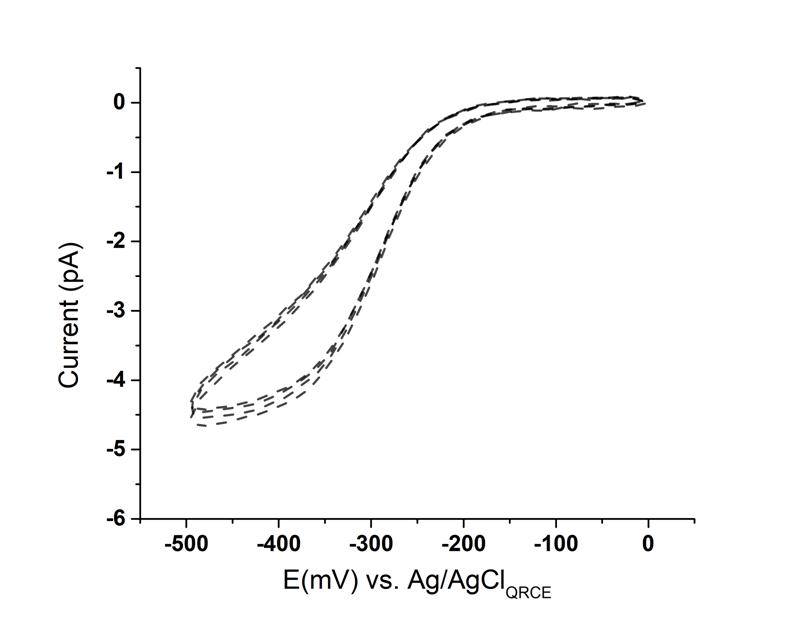
Figure 4. Four overlaid SECCM LSVs in 5mM [Ru(NH3)6]3+ and 50 mM KClat a sweep rate of 200 mV/s
The SECCM LSV is highly reproducible and robust. Figure 4 shows a set of 4 typical LSV curves obtained on HOPG at an increased scan rate of 200 mV/s.There is little variation between the consecutive CVs. The limit current value (-4.6 pA) is broadly similar to the one showed in Figure 3, which indicates a scan rate independence forthe nanoelectrode CV response. However, since the system cannot be considered as a true steady-state, this results in the slightly widening curve at the left bottom of Figure 4. This is due to the increased charging current with an increased scan rate.
To investigate the position-dependent electrochemical behavior, voltammetry measurements are recorded at an array of points using ARS mode. Briefly, after acquiring the first LSV, the Z scanner vertically retractsthe nanopipette by several micrometers above the first approached position on the surface. Then the XY scanner moves horizontally to a predetermined distance. The Z scanner lowers againuntil electrical contact is made with the surface. A second LSV curve is obtained, and the process repeats multiple times across the preset scanning area. As a proof-of-concept, 10 LSVs were collected at 10 adjacent positions to create an image of the electrochemical activity and were illustrated through the electrochemical current map. Figure 5A shows a SECCM current map obtained by plotting the current measured at fixed potential of −0.5 V vs. Ag/AgCl. The color contrast in this image corresponds to the current variation within ~1pA range for the generated 10 LSV over the scan area.Figure 5B and 5C show the individual full CV curve at position 1 and position 2. The similarity in the EC response can be attributed to the fact the nanopipette has landed on a basal surface instead of a step edge [2].More systematic studies are planned to correlate the surface structures with electrochemical activity.
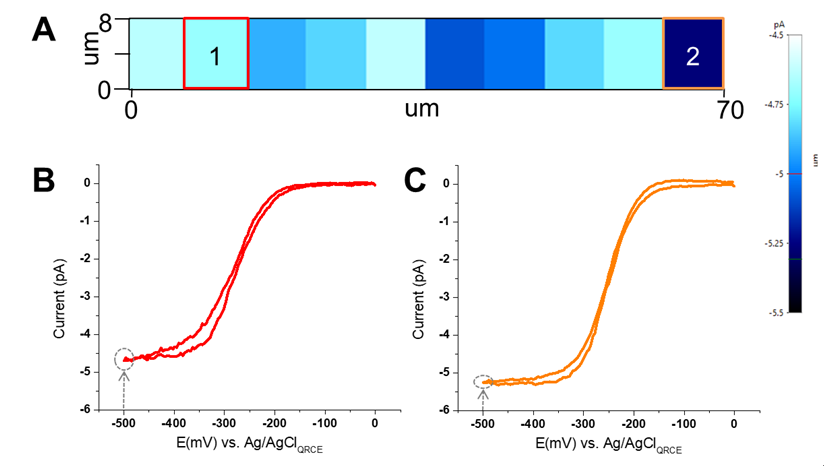
Figure 5.(A)Electrochemical current maps at -0.5 V vs Ag/AgCl on HOPG surface. Image is generated from a series of LSVs taken with the same nanopipette filled with 5mM [Ru(NH3)6]3+ and 50 mM KCl. The scan rate is 10 mV/s with the bias voltage starting from 0 and swept to -0.5 V vs Ag/AgCl.(B)& (C) Individual LSVs taken at position 1 and 2.
Conclusions
This application note examines the simplicity of the first commercial SECCM in assessing the nanoscale electroactivity mapping using the Park NX12 system and advanced SmartScanTM software. An electrochemically reversible [Ru(NH3)6]3+/2+ redox process at the HOPG surface is detected with high reproducibility and robustness, with a current limit as minuteas a few pA.Position dependence electrochemical current mapping is demonstrated using ARSmode. The results suggest that SECCM is the latest advancement in nanoscale electroanalysis, which has the potential to support advanced studies in energy storage.
References
[1]Güell, A. G., Ebejer, N., Snowden, M. E., Macpherson, J. V., & Unwin, P. R. (2012). Journal of the American Chemical Society, 134(17), 7258-7261.
[2] Güell, A. G., Cuharuc, A. S., Kim, Y. R., Zhang, G., Tan, S. Y., Ebejer, N., & Unwin, P. R. (2015). ACS nano, 9(4), 3558-3571.
[3] Gao, R., Edwards, M. A., Qiu, Y., Barman, K., & White, H. S. (2020). Gao, R., Edwards, M. A., Qiu, Y., Barman, K., & White, H. S. (2020).Journal of the American Chemical Society, 142(19), 8890-8896.
[4] McKelvey, Kim, et al. "Nanopipettes as a tool for single nanoparticle electrochemistry." Current Opinion in Electrochemistry 6.1 (2017): 4-9
[5] Bentley, Cameron L., Minkyung Kang, and Patrick R. Unwin. Analytical Chemistry 92 (2020): 11673−11680
[6] Wang, Yufei, Emma Gordon, and Hang Ren. Analytical Chemistry 92.3 (2020): 2859-2865.
[7] Shi, W., Goo, D., Jung, G., Pascual, G., Kim, B., & Lee, K. Simultaneous Topographical and Electrochemical Mapping using Scanning Ion Conductance Microscopy–Scanning Electrochemical Microscopy (SICM-SECM).
[8] Novoselov, K. S.; Geim, A. K.; Morozov, S. V.; Jiang, D.;Zhang, Y.; Dubonos, S. V.; Grigorieva, I. V.; Firsov, A. A. Science 2004, 306, 666−669.
[9] Bentley, Cameron L., David Perry, and Patrick R. Unwin. Analytical chemistry 90.12 (2018): 7700-7707.
[10]Ushiki, Tatsuo, et al. Micron 43.12 (2012): 1390-1398. [11] Snowden, M. E.,A. G. Güell,S. C. S. Lai,K. McKelvey,N. Ebejer,M. A. O'Connell,A. W. Colburn,P. R. Unwin, Anal. Chem., 2012, 84, 2483-2491.