


Study of dental implant using Atomic force microscopy
Introduction
The occurrence of tooth loss can be related to population ageing and accidents associated with road traffic, workplace, or sport activities. It is not only a cosmetic issue but also oral health and bite function of patients are affected. To help solving this issue, implant treatment has been widely adopted to repair missing teeth. Dental implants exhibit high success and survival rates over a long period of use [1]. However, there are potential risk factors remaining that may lead to implant failure. For instance, bone density, implant design, surgical technique and protocol were found to be responsible for the implant’s primary stability [2,3], and hence affect the implant recovery process. Surface characteristics of the implant screw play an important role in bone-to-implant contact (BIC) and structural remodeling of bone to accommodate the presence of an implant. A roughened implant helps enhancing the BIC rate through friction and mechanical anchorage by bone growth into the implant surface [4]. In this regard, different techniques including physical approaches (e.g., sandblasting, plasma spraying, thermal treatment) and chemical approaches (e.g., acid etching, anodizing) were introduced to control the implant surface roughness. Previous studies have found that chemical-based techniques provide higher surface roughness and friction coefficients than the physical ones [2,4], which is more advantageous in attaining an implant system with improved stability.
In this study, the surface characteristics of chemically etched dental implant screws were studied using atomic force microscopy (AFM). In detail, effects of acid mixture components and etching temperature on the implant surface roughness were experimentally quantified. The outcome is expected to add more information on surface modification of dental implants and provide a general approach on how to characterize the surface roughness of a sample with AFM, especially for samples with complicated structures such as implant screws.
Experimental approach and results
Conventional titanium (Ti) dental implant screws were used as samples. The implant surfaces were modified based on acid etching processes. Mixtures of hydrochloric acid: nitric acid: deionized water (HCl:HNO3:H2O) with ratios of 3:3:4 and 3:5:2 (in wt. %) were prepared. Given that Ti metal exhibits different corrosion resistance in hydrochloric and nitric acids [5], the use of different mixing ratios was expected to give a better understanding on the effect of acid components on the surface roughness of the Ti implant screw. In addition, to investigate the effect of temperature on the etching result, the etching was conducted at ambient temperature and 80 °C. Etching time was set to 5 minutes for each sample. A total number of five samples including one pristine reference sample and four chemically etched samples were then employed for AFM measurement.
A Park SYSTEMS FX40 was used to investigate the effects of acid ratio and etching temperature on the surface roughness of the samples. A conventional silicon probe (OMCL-AC160TS, Olympus) was used to collect topography data in True Non-ContactTM mode. Prior to the measurements, the AFM scanners were calibrated using a reference grating. Considering that the structure of dental implant screws is relatively complicated, an optical microscope integrated into the AFM was used to initially inspect the sample surface to find appropriate positions for AFM measurements. Fig. 1 shows the optical images captured at different locations including top, bottom, thread, and cut groove areas of the implant screw. The green arrows indicate good focal areas while the red ones indicate out-of-focus areas. The camera cannot fully focus on the overall surface of the top, thread, and cut groove locations. This indicates that these locations have a large variation of height, which can be an issue for AFM scanning as the Z scanner range is limited to roughly 15 μm. In contrast, the bottom location of the sample exhibits a relatively smooth surface and is an appropriate location for AFM measurements.
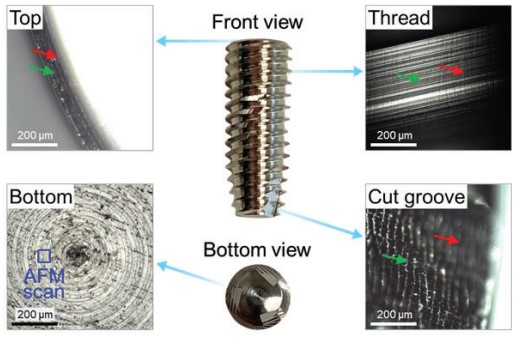
Fig. 1. Optical images obtained at different locations on an implant screw.
The screw has a length of about 13 mm and a diameter of about 4-5 mm. All images were obtained using a 10x optical microscope integrated into the AFM system
Considering that the surface roughness is a function of scan size, the scan size was varied to find optimal conditions for AFM scanning. Firstly, a maximum scan size of 100 x 100 μm² was used to collect topography data over a large area. Fig. 2 presents the height image obtained on the reference sample. As shown in the height image and cross-sectional profile in Fig. 2(a), the sample surface has a wave structure with waviness spacing up to approximately 40 μm. This structure may originate from the implant manufacturing process. To measure the impact of the wave structure on the surface roughness calculation, the root-mean-square roughness (Rq) was calculated at different scan sizes, ranging from 10 x 10 μm² to 100 x 100 μm² as denoted by the masked blue boxes in the height image of Fig. 2(b). Rq was found to increase with increasing scan sizes up to 50 μm² and saturates beyond 50 μm². The results suggest that cut-off length plays an important role in roughness calculation results, depending on specific structures of the sample surface. To appropriately characterize the sample surface in this case, a minimum scan size of 50 x 50 μm² must be selected. It should be noted that in AFM, to optimize the scan time and preserve the tip apex, the scan size should be controlled at a minimum extent necessary to adequately provide required information on sample, as it plays a huge role in the effective speed of the tip movement and in some cases the tip wear. Hence, optimization of scan size is important.
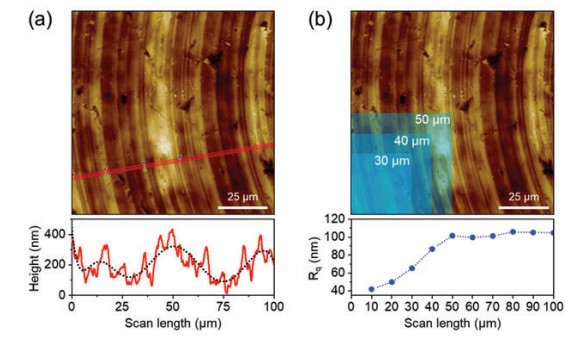
Fig. 2. Height image obtained on reference sample. In (a), black dotted line represents polynomial
fit to cross-sectional profile. From 100 x 100 μm² scan image in (a), masked regions with different scan
length from 10 to 100 μm are selected to deduce surface roughness using Park data analysis software. As examples, masked regions of 30 x 30 μm², 40 x 40 μm², and 50 x 50 μm² are denoted by blue boxes in (b).
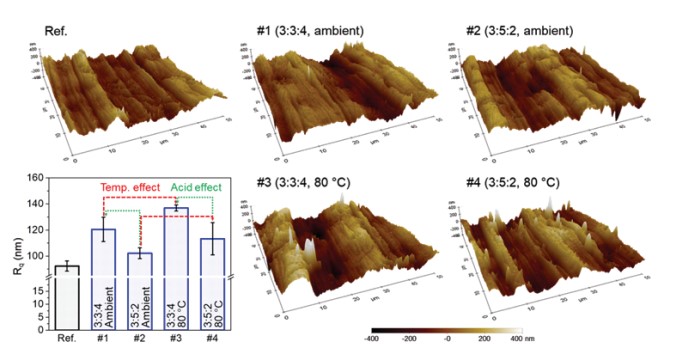
Fig. 3. 3D height images obtained on all samples. X:Y:Z ratio was set to 1:1:15. All images were plotted at same scale with matching color palette range. In Rq plot, error bar represents standard deviation of Rq obtained at three randomly chosen locations. Effects of etching temperature and acid ratio on roughness were denoted using red and green arrows, respectively
Fig. 3 summarizes the topography measurement results on the samples. For each sample, three locations on the surface were randomly selected and measured to analyze the surface roughness distribution and surface homogeneity. The scan size was set to 50 x 50 μm² for all samples. From the results in Fig. 3, a large height variation on the surface due to acid etching was observed. This effect is quantified in table 1. In general, variation of surface roughness was found to be smaller than 10 % for the samples used in this study, suggesting a relatively uniform surface and well-controlled etching process. Compared to the reference sample, surface roughness was found to increase by 11-48 % as a result of acid etching process. Also, when temperature increased from ambient to 80 °C, Rq increased by 14 % for 3:3:4 acid ratio (sample #3 compared to #1), and 11 % for 3:5:2 ratio (sample #4 compared to #2). As expected, chemical interaction between implant sample and acid mixture can be enhanced at elevated temperature, leading to increased corrosion of Ti surface [5]. In terms of the effect of acid ratio, samples with acid ratio of 3:3:4 exhibited a rougher surface than 3:5:2 ratio. In particular, Rq values of sample #1 were about 18 % larger than sample #2, and sample #3 was about 21 % larger than sample #4. Considering that Ti is resistant to oxidizing acids such as HNO3, and is corroded by reducing acids such as HCl, it is plausible that the addition of more nitric acid component into the mixture reduces the corrosion of sample surface [6], as observed on samples #2 and #4. This result suggests that Ti etching reaction can be controlled by varying the ratio of acid components in the reaction agent. Among the treated samples, sample #3 shows the most advantageous roughness to attain high BIC rate for a more stable implant.
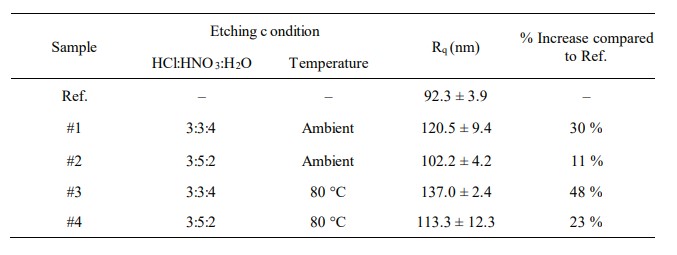
Table 1. Summary of surface roughness of all samples. Uncertainty of Rq represents 1 standard deviation.
Summary
In this study, the effects of acid etching conditions on surface characteristics of Ti implants were investigated at the nanoscale using AFM. The results suggest that one can tailor the surface roughness of Ti implants by controlling the etching conditions such as temperature and acid mixture. Additionally, a general guideline for surface characterization of samples with complicated structure using AFM was introduced and discussed.
References
1. O. Geckili, H. Bilhan, E. Geckili, A. Cilingir, E. Mumcu, C. Bural, Evaluation of Possible Prognostic Factors for the Success, Survival, and Failure of Dental Implants, Implant Dent. 23 (2014) 44–50.
2. M.V. Dos Santos, C.N. Elias, J.H. Cavalcanti Lima, The effects of superficial roughness and design on the primary stability of dental implants., Clin. Implant Dent. Relat. Res. 13 (2011) 215–223.
3. X. Gao, M. Fraulob, G. Haïat, Biomechanical behaviours of the bone–implant interface: a review, J. R. Soc. Interface. 16 (2019) 20190259.
4. F. Butz, H. Aita, C.J. Wang, T. Ogawa, Harder and stiffer bone osseointegrated to roughened titanium., J. Dent. Res. 85 (2006) 560–565.
5. D. Prando, A. Brenna, M.V. Diamanti, S. Beretta, F. Bolzoni, M. Ormellese, M. Pedeferri, Corrosion of titanium: Part 1: aggressive environments and main forms of degradation., J. Appl. Biomater. Funct. Mater. 15 (2017) e291–e302.
6. Titanium Metals Corporation (TIMET) technical manual (https://www.timet.com/assets/local/documents/technicalmanuals/corrosion.pdf).