


Gerald Pascual, Byong Kim, Mina Hong, John Paul Pineda, and Keibock Lee
Technical Marketing, Park Systems
Introduction
The addition of nanotechnology to textile development can yield next-generation fabrics for many new exciting applications. Understanding the characteristics of the nanomaterials being integrated with existing fabric matrices is paramount in predicting how targeted enhanced properties will manifest in novel composites. For example, weaving nanofibers into tear-resistant fabric can significantly further increase the fabric's strength without significantly increasing its weight. This is a nanoscale approach similar to techniques have been demonstrated in the development of robust materials such as fiber reinforced plastics. Next-generation fabrics look to emulate the durability and weight advantages of fiber reinforced plastics, but within the domain of the textiles industry and by looking for solutions at a much smaller scale. Atomic Force Microscopy (AFM) can be used to study the interactions between the fibers and the fabric matrix, their interfacial regions, and the composite's topography—all points of knowledge helpful in adjusting the composite's makeup for maximizing performance gain and minimizing production cost. To this end, AFM was used to characterize the nanomechanical properties of a polyester fiber interaction with a silicon matrix.
Experiments
silicon matrix sample embedded with strands of polyester yarn was provided by Prof. Yan Vivian Li at Colorado State University [1]. The AFM experiment was conducted using that sample under ambient air conditions using a Park NX10 SPM system in non-contact AFM mode for topography imaging and phase imaging. Both sets of data are acquired simultaneously; topography imaging is useful primarily for observation of three-dimensional features on the surface of the sample while phase imaging yields data that can be correlated to the sample's elastic properties. The nanomechanical properties of the sample were characterized primarily using force-distance spectroscopy and forcevolume mapping; these results were then correlated to data acquired by phase imaging. In force-distance spectroscopy, force-distance (f-d) curves are used to measure the force that an AFM probe applies vertically to a single point on a sample surface. F-d curves are plots of the cantilever's deflection, as measured by a position-sensitive photodetector, versus the extension of a piezoelectric scanner [2]. Force-volume mapping builds on force-distance spectroscopy in that it takes an array of single measurement points and turns the collected f-d curves across the sample surface into a 2D characterization map of hardness [2]. Hardness is defined as the slope of the f-d curve given in the units of N/m. Lastly, phase imaging is an AFM technique that makes use of the shift in a cantilever's oscillation as its tip moves across different features on the sample. The difference in the input signal for tip's oscillation versus the ensuing oscillation's output signal is referred to as a shift in phase [3]. This particular signal can be correlated to several material properties such as elasticity.
RESULTS & DISCUSSIONS
A cross-section view of the silicon matrix (pink in color) is shown in Figure 1 with a strand of polyester yarn (dark circular feature in center, 100-150 μm in diameter). Here three regions were selected for investigation. Region 1 is situated directly on the exposed strand of embedded polyester yarn. Region 2 is the interface between the embedded polyester yarn and the silicon matrix surrounding it. Region 3 is an area composed entirely of the silicon matrix.
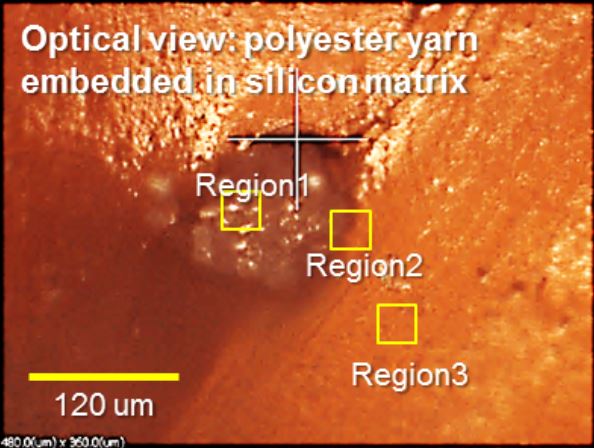
Figure 1
Figure 2 contains non-contact AFM topography images taken from each of the regions selected in Figure 1 as well as f-d curves that were measured at the selected sites within each of those regions. The shape of the f-d curves correlate to a measure of the physical interaction between the tip and sample; in this case, the tip-sample distance vs. the force load on the tip cantilever. As such, the slope of the f-d curve is steeper when the tip presses on a harder sample.
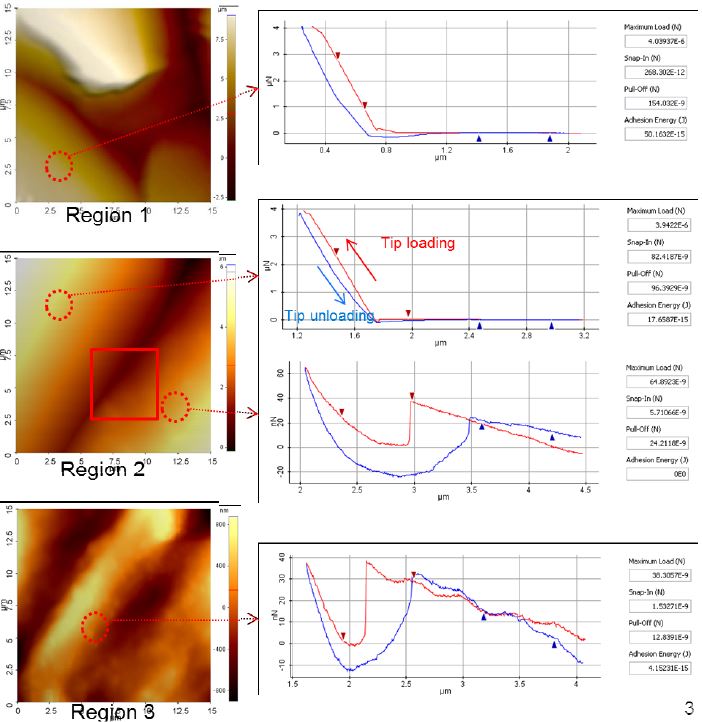
Figure 2
In Region 1, a location on the sample's polyester yarn, a site in its lower-left corner was selected for force-distance spectroscopy. The f-d curve at this site reveals that the force applied by the tip to the sample increases by about 4 μN over a distance of about 0.5 μm as the tip pushes down onto the surface. In Region 2, a pair of sites was measured at the sample's interfacial region: the first site is in the left half of the image (the area composed of the polyester yarn) and a second site in the right half of the image (an area composed of the silicon matrix). The f-d curve for the polyester yarn side of the interfacial region again exhibits a force of about 4 μN being applied by the tip to the sample over a distance of about 0.5 μm. The f-d curve at the site corresponding to the silicon matrix portion of the region yields different data. An initial increase of just under 40 nN in the force applied by the tip to the sample occurs over a distance of approximately 1.25 μm. At which point a steep drop-off of about 40 nN in the tipapplied force is observed. It is possible that the drop-off in applied force is due to the tip being pulled onto the surface of the silicon matrix. A second increase in tip-applied force occurs as the probe continues pressing onto the matrix. Here the observed increase in force is measured to be about 50 nN over a distance of 0.5 μm. In Region 3, a location on the sample's silicon matrix, we observe a two-stage force load increase similar to the one exhibited by the silicon matrix half of the previously investigated interfacial region. The initial tip-applied force builds up to about 40 nN over a distance of 1.5 μm just before plummeting to about 0 nN. Again, this sudden decrease in applied force is speculated to be the moment in which the tip has snapped onto the surface of the silicon matrix. Shortly thereafter, a second increase in tip-applied force is observed as the probe continues to be pushed down onto the matrix resulting in a load increase of about again 40 nN over a distance of about 0.5 μm. In this investigation, fd curves taken from a region within a strand of polyester yarn show a force load on the tip's cantilever that is approximately 100 times greater than the load shown on an f-d curve from the silicon matrix at the similar tip-sample distances.
In order to increase the area of observation from single points to whole sections of the sample's surface, force-volume mapping was applied as depicted in Figure 3. This technique allows us to create a 2D map of the sample's nanomechanical properties—in this case, hardness. To begin, a small area within Region 2 as shown in Figures 1 and 2 was selected for hardness mapping as the interfacial region of the sample would allow us to investigate both the polyester yarn and the silicon matrix simultaneously. This location is indicated by the inset red square in the non-contact AFM topography image for Region 2 shown in Figure 2. The location for force-volume mapping measures 5 x 5 μm and is depicted in all of the images making up Figure 3. The next step was to overlay a 16 x 16 grid over the location to be mapped thus creating an array of 256 total sites. F-d curves were measured at the midpoint of each of these sites and the data was translated into a 256 pixel hardness map where each pixel represents the sample hardness detected at the midpoint of each site. Note the sharp difference in the colors of the hardness map's pixels which closely follows the interfacial region's border between the polyester yarn and the silicon matrix as shown in Figure 3's topography image. A similar phenomenon is observed with the phase image as well—the upper-left portion of the phase image corresponds to the embedded yarn and has a profoundly different phase signal than the remaining portion of the image depicting the silicon matrix. This indicates that the phase shifts in the cantilever's oscillation are markedly different when the probe moves across the yarn versus across the matrix suggesting a difference in material elasticity.
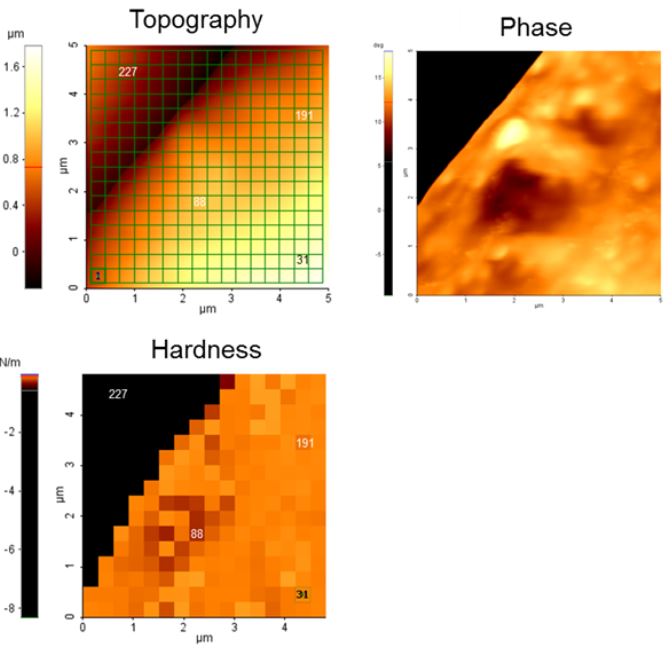 Figure 3
The final leg of the investigation repeated the f-d curve comparison that was depicted in Figure 2; however, this time the sites selected for analysis were exclusive to the interfacial region of the sample focused on in Figure 3. A total of 4 sites were selected from the array of 256 superimposed on the topography image in Figure 3 and are referred to hereafter as sites 31, 88, 191, and 227. The first three sites are located within the silicon matrix area of the interfacial zone whereas site 227 is located on the polyester yarn. The f-d curves for each of the four selected sites are shown in Figure 4. The f-d curve of site 227 is shaped as expected given our previous experience in measuring Region 1 (polyester yarn) on Figure 2. Again, a force load of about 4 μN over a distance of about 0.5 μm is observed. Sites 31, 88, and 191 also have f-d curves that were anticipated by having previously measured Region 3 (silicon matrix) on Figure 2. These three sites all have the same force load increase marked by a steep drop-off in tip-applied force as the probe snaps onto the matrix. The second force load increase is again measured to be around 40 nN over a distance of 0.5 μm. This 2D mapping data is consistent with the single-point force-distance spectroscopy data acquired earlier in the investigation.
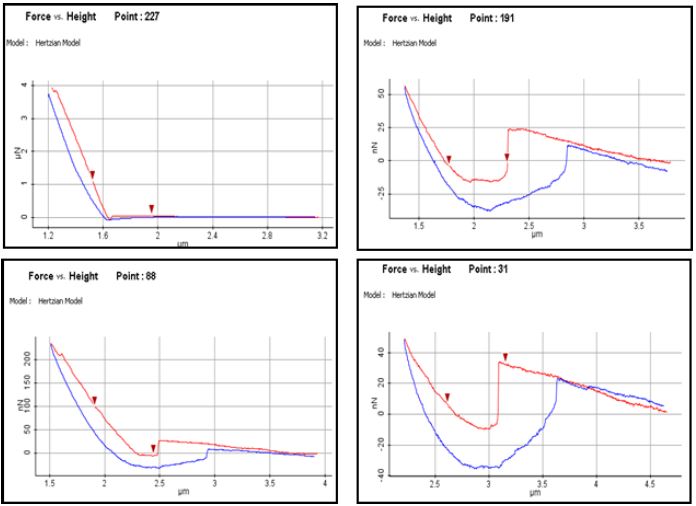
Figure 4
Given that the nanofibers of polyester yarn have been observed here to be around 100 times harder than the gel matrix they are embedded in, it is reasonable to conclude that the gel's original resistance to certain types of damage may have been positively augmented by the embedded yarn. The nanomechanical property focused on during this investigation was that of hardness. The hardness of a material is generally correlated to its elasticity, plasticity, and/or its resistance/inclination to fracture. In fiber reinforced plastics, embedded fibers allow the novel composite to remain in one piece despite having a large, shattering force applied to it. The novel composite also potentially has significant weight savings when compared to the material it is being designed to replace. When applied to the domain of textiles and apparel, nanofibers such as the ones investigated here can be embedded in more than just gel matrices and have been woven into existing fabrics such as cotton to confer traits such as increased aerosol filtration [4]. A nanofiber specifically selected for its hardness may conceivably increase a composite fabric's damage resistance leading to immediate uses in ballistics as well as other applications that require clothing with heightened durability.
Summary
The topography, phase image, and a nanomechanical property map (based on f-d curve data) of a silicon gel and polyester yarn sample were acquired using a Park NX10 SPM system. The data collected in this investigation reveals that the strands of polyester yarn are approximately 100 times harder than the silicon gel matrix they are embedded in. All data acquisition was performed at nanoscale with forces on the order of nanonewtons being observed across distances of a few micrometers. Performing measurements at this scale is an effective demonstration of AFM's capability to characterize key properties of nanomaterials being used in the creation of novel composites such as next-generation fabrics. A better understanding of the nanoscale behavior of such materials enables educated speculation on the macroscopic effects their inclusion in a composite would induce.
REFERENCES
[1] Li Research Group. (n.d.). Retrieved April 22, 2016, from https://sites.google.com/site/smartextilesnanotech/
[2] Park AFM Nanomechanical Mode. (n.d.). Retrieved April 22, 2016, from http://www.parkafm.com/index.php/park-afm-modes/nanomechanical-modes
[3] 17.3.3 Phase Imaging. (n.d.). In W. N. Sharpe (Ed.), Spring Handbook of Experimental Solid Mechanics (p. 430). Springer Science & Business Media.
[4] 10.3 Nanofibers as Filters. (n.d.). In Kiekens, P., & Jayaraman, S. (Ed.), Intelligent Textiles and Clothing for Ballistic and NBC Protection: Technology at the Cutting Edge. (p.210). Springer Science & Business Media.