


Using AFM PinPoint™ Nanomechanical Mode for Quantification of Elastic Modulus in Materials Two Orders of Magnitude Faster than Force Volume Spectroscopy
John Paul Pineda, Gerald Pascual, Byong Kim, and Keibock Lee Park Systems Inc., Santa Clara, CA USA
Introduction
Since the invention of atomic force microscopy, AFM has had a revolutionary impact in material sciences and device engineering by providing accurate, reliable, non-destructive imaging at the nanoscale. AFM is used across a wide range of nanotechnology applications such as biomedical implantable actuators to ultrathin cathode material for batteries to photo detectors and switches for memory storage and logic circuits.[1-3]As the dimensions of devices continuously shrink, measurement methods of local properties of materials have become more effective over bulk property in providing accurate nanoscale measurement. Local mechanical properties such as adhesion and elastic modulus are critical parameters in determining the reliability and performances of these devices. [4-6]There were existing AFM-based nanomechanical methods introduced to measure the mechanical properties, examples include force-volume spectroscopy and nanoindentation. However, some of these techniques are extremely time consuming and others are destructive which doesn’t allow in situ and high-throughput monitoring in certain applications. Figure 1 demonstrates the principles of AFMPinPoint™ nanomechanical modedeveloped by Park Systems. The patented PinPoint™ technique is at least two orders of magnitude faster than the conventional force-volume technique which allow users to acquire quantitative mechanical properties and high-resolution topography images of materials simultaneously in a short period of time.During operation, the tip moves in approach-retract manner, ensuring a frictionless operation which eliminates the lateral force due to continuous tip-sample contact and preserves tip and sample condition, ideal in measuring both hard and soft samples such as hard disks and biological samples. At each point of the image, force-distance curve is acquired and used to calculate the mechanical characteristics of the sample being measured.During data acquisition, the XY scanner stops, and the contact time is controlled to give enough time for the scanner to acquire precise and accurate data. In this experiment, 4different materials with various ranges of modulus were successfully quantified. The results acquired for each test are close to the nominal modulus value of each material, proving the superior ability of the PinPoint™ mode in quantification of mechanical properties. In addition, high-resolution images were acquired simultaneously which revealed the surface features of the samples.
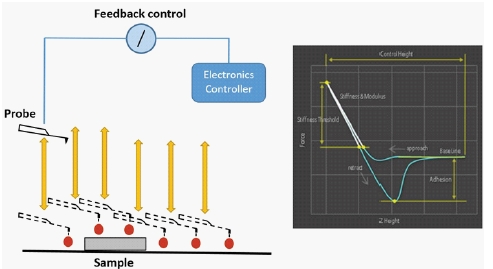
Fig. 1. Principles of PinPoint™ nanomechanical mode by Park Systems. This diagram demonstrates the feedback-controlled approach and retraction of a probe at multiple sites along a sample’s surface. Feedback control from the AFM systems’ controller allows this technique to acquire both surface topography. The F/D curve demonstrate how Pinpoint extracts mechanical property data.
Experimental
Sample and Tip
An Olympus micro cantilever (OMCL-AC160TS) with nominal spring constant k = 26 N/m and resonant frequency f = 300 kHz was used to measure the Highly Ordered Pyrolytic Graphic (HOPG), Polydimethylsiloxane (PDMS) and Polystyrene – low density polyolefin elastomer (PS-LDPE)in the experiment.The HOPG sample is a highly ordered form of highly pure Pyrolytic Graphite annealed under high temperatures and pressure to obtain a high degree of crystallographic orientation. The PDMS sample is a silicone polymer which is physically soft like rubber or resin mounted on a magnetic sample disk.The PS-LDPE sample is a copolymer composedof PS and PE that were spin-cast onto a silicon substrate creating a film with different modulus properties. PS serves as the matrix while PE is the low density doping component.[8]
Pinpoint Imaging Conditions
The samples were investigated using Park NX20 AFM system under ambient air condition.Except for scan range, the scanned parameters used in measuring the sampleswereall the same.
Results and Discussion
Hertzian model
The quantification of mechanical properties of Pinpoint mode such as elastic modulus is based on the well-established Hertzian model. In this technique, it is assumed that no other interaction other than elastic deformation can be observed between tip and sample. The calculation is based on the equation E (Elastic modulus) = F (Loading force). This equation is greatly affected by the tip geometries. Assuming that a spherical tip with specific radius (R) was used to indent elastic halfspace to a displacement of d, the applied force can be derived as below:
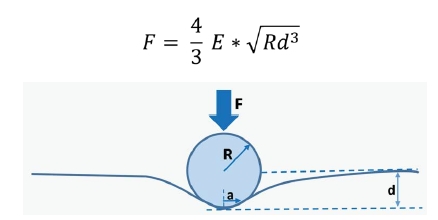
Fig. 2.Illustration of spherical tip and sample interaction showing the displacement created in the sample surface as force is applied.
By measuring the corresponding F, R, and d, the E* can be reversed-calculated. However, E* is a function of two material and its equation can be expressed as below:
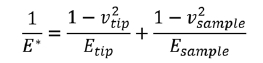
Etip and Esample are the elastic modulus of the two materials and νtip and νsample are their corresponding Poisson's ratio. By knowing E*, Etip, νtip and νsample, Esample can be reversed-calculated. [7]
Table 1 shows the topography images andthe correlated maps of elastic modulus acquired during the tests. The images acquired in this experiment were all analyzed using XEI software developed by Park Systems which mapped the acquired signals to a color table. For topography images, the intensity of the shading correlates to the surface height variation with extremely bright and dark areas having the highest and lowest height regions. Same thing applies with the elastic modulus, wherein brighter and darker regions correspond to areas with highest and lowest elastic modulus. The topography image of HOPG revealed that surfaces of the sample are made of atomic terraces with step edges. These terraces demonstrate a homogenous diagonal path and they were measured to have approximately 1.5 nm step height. On the other hand, the elastic modulus map shows only few variations on the mechanical property of thesample surfaces. The diagonal dark lines visible on the elastic modulus imagerepresent the surfaces with low modulus. The topography image of the PDMS revealed the rough surface of the sample. It can be also observed on both topography and modulus image that there are only few variations on height and modulus of the surfaces. The topography image of PS-LDPE confirms that the sample is compose of two different materials. The dark circular dots features are the LDPE (low density polyolefin) materials, while the brighter regions in this image are the PS (polystyrene) materials. As expected, the elastic modulus map of this sample has two domains, wherein LDPE materialsrepresented by the dark circular dots are the domains with lower modulus, while PS represented by the areas with bright color are the domains with higher modulus.
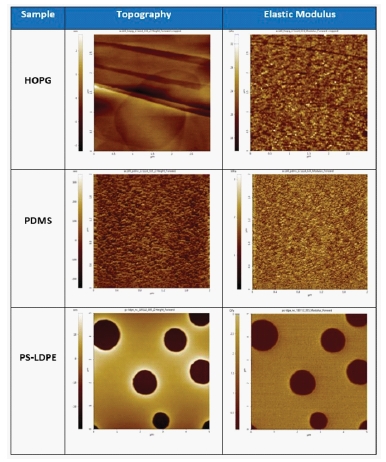
Table. 1. Topography image andcorrelated maps of elastic modulus acquired for each material.
The quantitative results of elastic modulus are shown in Table 2 and corresponding graph shown in Figure 3. The results were plotted to better analyze the data. To evaluate the performance of Pinpoint mode, the results acquired in this experiment were compared to the nominal values of each sample. And it was found out that the measured modulus values of all the samples are close to their nominal values. For HOPG, the measured modulus is22.09 GPa, close to its nominal value of 18 GPa. For PDMS, the measured modulus is0.0018 GPa, close to its nominalvalue of .003 GPa.While for PS-LDPE, the measured values are1.955 GPa and 0.132 GPa, which are also comparable to their nominalvalues of 2 GPa and 0.1 GParespectively.The standard deviation of the modulus results were also calculated and based on the results, PDMS sample has the lowest standard deviation with Std = 4.03E-04 GPa, while HOPG sample has the highest standard deviation with Std =2.224 GPa.
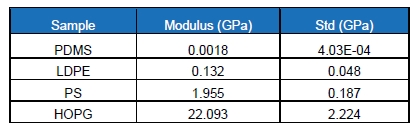
Table. 2. Measuredmean and standard deviation (Std) of elastic modulus.
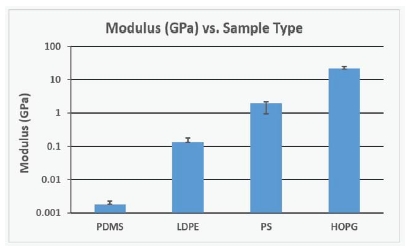
Table. 3. Plotted value of measured mean and standard deviation of elastic modulus.
Conclusion
The quantitative and qualitative data of the four materials were successfully acquired by Park NX20 AFM usingPinPoint™ nanomechanical mode.The surface features of the samples such as the atomic terracessurface of the HOPG, the rough surface of the PDMS, and the circular dots matrix of the PS-LDPE were clearly observed on the topography images.The measured elastic modulus of each samplewascloseto theirnominal modulus value, confirming the capability of PinPoint™ nanomechanical modein quantifying a wide range of mechanical properties of various materials.The newPinPoint™ nanomechanical mode asdemonstrated in this experiment provides researchersaccurate material surface
References
[1] Dr. R. Cook, Nanomechanical Measurements and Tools, Written by AZoNanoJan 17 2010.
[2] F. Wu, et al., Ultrathin Spinel Membrane-Encapsulated Layered Lithium-Rich Cathode Material for Advanced Li-Ion Batteries, Nano Lett., 2014, 14 (6), pp 3550–3555.
[3] H. Kind, et al., Nanowire Ultraviolet Photodetectors and OpticalSwitches, Advanced Materials.
[4] Z. Drira, et al., Nanomechanical measurements of polyethylene glycol hydrogels using atomic force microscopy, Volume 18, February 2013, Pages 20-28.
[5] J. Pineda, et al., Optimum Current Distribution Measurement of Zinc Oxide Nanorods via PinPoint™ Conductive AFM.
[6] C. Clifford, et al., Quantification issues in the identification of nanoscale regions of homopolymers using modulus measurement via AFM nanoindentation, Applied Surface Science, Volume 252, Issue 5, 15 December 2005, Pages 1915-1933.
[7] M. Hong, et al., Collagen Fibrils Imaging in Air and in Liquid Using Atomic Force Microscope-Based Fast Nanomechanical Mode.
[8] W. Shi, et al., PinPoint Nanomechanical Mode Using Probes with Different Stiffness