


Tooth Whitening Study using PinPoint Nanomechanical Mode of Park AFM
Alvin Lee, John Paul Pineda, Byong Kim, and Keibock Lee Park Systems Inc., Santa Clara, CA USA
Introduction
In recent years, the importance of mechanical properties measurement has become evident in various applications, ranging from understanding and screening of integrated circuit failure mechanisms of microelectronics, to diagnosis of diseases in the field of medicine, and to the development of restorative materials for human teeth [1-3]. Some samples when pressed with too much force can lead to surface deformation and change initssurface characteristics which may result to inaccurate assessment of measurements. Moreover, since the sizes and features of interest in functional materials are continuously shrinking downto nanoscale level,and given that material failures start from atomic lattice structures, conventional techniques used in materials characterization are no longer adequatein identifying defects and abnormalities on material surfaces asthey only allow up to millimeter range measurements. For these reasons, a nextgeneration characterization tools that is benign and allow nanoscale measurements is greatly needed.Recently, a new operational AFM mode developed by Park Systems called PinPoint ™ Nanomechanical mode [4] offers researchers an innovative solution to these problems. This technique operates by allowing the tip to move in approach-retract manner with only few nano-Newton force ensuring a frictionless operation thateliminates the lateral force due to continuous tip-sample contact and preserves tip and sample condition. At each point of the image, force-distance curve is acquired and used to calculate the mechanical characteristics of the sample being measured. During the data acquisition, the XY scanner stops, and the contact time is controlled to give enough time for the scanner to acquire precise and accurate data with nanoscale resolution.
Every material structure deteriorates over time when kept in natural setting. Such changes originate from a point defect atthe nanoscale level. This also applies to the teeth whitening process. Everyone who whitens teeth desires for the teeth to remain whitened without redoing it too often. Thus, to realize this, one must know how the topological and mechanical changes take place on the surface of teeth at the nanoscale level. In this study, PinPoint Nanomechanical mode was used to acquire topographical and mechanical data of a tooth sample to understand the effect of tooth whitening strips on the tooth’s mechanical and topographical properties. The results show that tooth whitening strips lead to a decrease in tooth roughness and an increase in modulus and adhesion. This newly developed technique by Park Systems will enable researchers to investigate the topographical and mechanical properties variations ofdifferent varieties of samplesatnanoscale level.
Experimental
A tooth sample was analyzed using a Park NX10 AFM [5] under ambient air condition. PinPoint Nanomechanical mode with AC160TS tip (nominal spring constant k = 26 N/m and resonance frequency f = 300 kHz) [6]was used in the measurement to acquire topography and mechanical signals. Before undergoing AFM scanning, the tooth was treated by placing it in deionized water and left to sit for 30 minutes followed by placing in 50% by volume isopropyl alcohol for 2 minutes, then rinsed again in deionized water. Compressed air spray was used to dry off the tooth. This was in attempt to remove “debris” and “dirt” from the teeth that may have accumulate on to the teeth over the time.Figure 1 shows the setup of the experiment. A carbon tape and super glue were used to stabilize the sample during imaging. Tooth was placed onto a magnetic disk and stuck to double sided carbon tape. To be sure that the tooth was secured and would not move while taking measurements, a toothpick was placed to hold the tooth upward so that an area of the tooth would be leveled for examination. Superglue was used for extra stability.
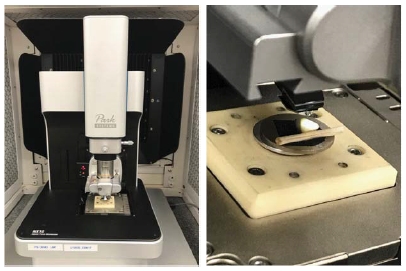
Fig. 1.Experimental set up of the tooth sample. Tooth underneath Park NX10 AFM system (Left). Tooth with AC160-TS tip landed onto sample (Right)
To validate the acquired modulus values, a referencesample was used. The sample was a PS-LDPE blend film (polystyrene and polyolefin elastomer). The scanparameters were setsuch thatthe modulus measurements were measuredto be ~2.0 GPa for the PS matrix, and ~0.1 GPa for the circular features that appeared in the modulus imagesthat are blended into the matrix which were in agreement with the manufacturers’ description of the PS-LDPE sample [7].Figure 2 shows the 15x15 μm acquired modulusimages of PS-LDPE reference sample. The images were analyzed using Park XEI software developed by Park Systemswhich mapped the acquired signals to a color table. The darker regions (color black in Fig. 2 Left)with circular features represent the areas with lower modulus values while the lighter regions (color brown in Fig. 2 Right) with flat surface known to be the PS matrix are the areas with higher modulus. All areas with purple color mean that these areas are excluded in calculating the mean modulus value. The calculated elastic modulus mean of the LDPE copolymer region is 0.116 GPa while for the PS polystyrene flat region is 2.039 GPa.
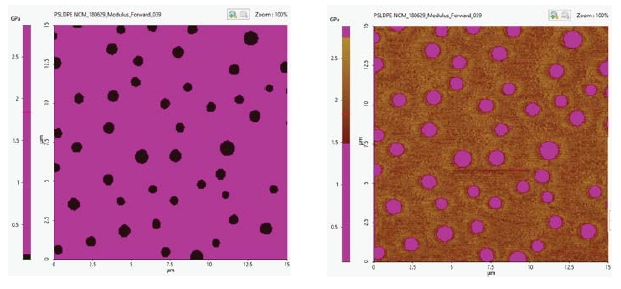
Fig. 2.15x15 μm image of PS-LDPE reference sample. Image with polystyrene flat region excluded in the elastic modulus mean calculation (Left). Image with copolymer region excluded in the elastic modulus mean calculation (Right).
After the reference sample measurements were taken, the tooth was placed under the Park NX10 AFM with the same tip used for reference sample measurements. For statistical relevance, three measurements were taken at three different teeth surfaces of the same teeth sample that could be found using the optical microscope built in to the Park AFM. Measurements were taken in areas of the tooth no farther than 500 microns apart so that roughly the same area arebeing imaged consistently. These measurements were performed using the same scan parameters as were used for the PS-LDPE reference sample. These parameters were utilized because under those conditions, the AFM recorded accurate modulus values. To whiten the tooth sample, whitening strips were used [8]. One strip was applied onto the tooth surface and left to sit for the recommended 1-hour period. After this, the tooth was rinsed in deionized water and dried off with compressed air spray. A total of 3 whitening strips were used as the final whitening.
Results and Discussion
The representative topographical and mechanical images acquired in the experiment were presented on Table1. The images were also analyzed using the Park XEI software. The quantitative results of elastic modulus are shown in Table 2. The experimental values of the elastic modulus before and after the whitening process were compared on the previous studies [2].The tooth is composed of three major layers, known as the enamel, dentin, and cementum. These layers are found in the respective order: enamel at the surface, dentin underneath the enamel, and cementum underneath the dentin.Based on the existing studies, the elastic modulus of the top layer of the teeth was found to be 1.3382 ± 0.3079 GPa. The measured values of the elastic modulus before were1.072 GPa and it increases up to 1.571 GPa after the whitening process.Same trend was observed on the adhesion energy values wherein the measured adhesion energy before was found to be 0.196fJ and it increases to 1.608fJ after the whitening process. On the other hand, the surface roughness was observed to be in decreasing trend wherein the surface roughness before was characterized to be 201.0 nm while the value for surface roughness after the application of the whitening strips was 38.33 nm.
Tooth whitening via whitening strips is known to workby reacting the hydroxide chemicals on the strip with the staining molecules known as chromogens on the surface of the tooth. This reaction is known as oxidation. The oxidation causes the chromogen molecules to break down when gaining electrons from the hydroxide, causing it to split into molecules that do not reflect light and can be removed from the tooth later.As for whitening treatment, expectations based on previous studies were that the hardness would fall and the roughness would increase with more whitening applied [9-10]. This experiment however found that roughness decreased and modulus increased. A possible explanation wouldbe that the hydroxide oxidation caused the surface to be smoothed out as staining chromogen molecules would be removed from the tooth, while modulus increased because the chromogens had a lower modulus than the enamel itself.
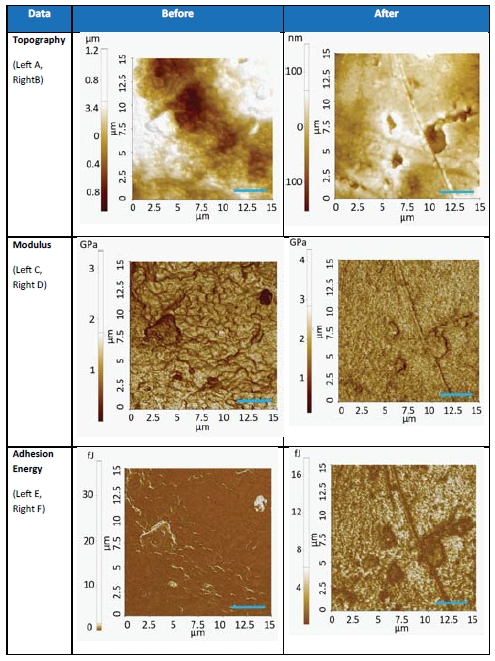
Table 1. A table of before and after whitening treatment was applied. The same 15 by 15 micron scan region was used for the before-images, as well as the after-images. These images used were representative of the change caused by whitening treatment, as the data values coincided closely with the mean.Scale bars: 3 μm.
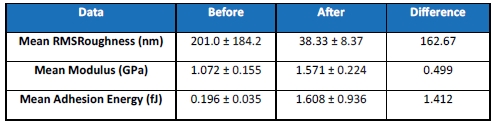
Table 2. Mean values of before whitening and the third and final whitening.
Conclusion
The topography and mechanical data of the tooth sample was successfully acquired by the Park NX10 AFM using PinPoint Nanomechanical mode.Based on the data acquired through this testing,PinPoint Nanomechanical mode found that its method of characterizingmechanical properties of teeth match and agree with mechanical properties found in other methodssuch as macro and microindentation. It was also found that the tooth roughness decreases and the elastic modulus as well as the adhesion properties increase after it had undergone whitening process. Overall, PinPoint Nanomechanical Mode introduced by Park Systems is an ideal approach to characterize and quantify mechanical properties at nanoscale, with faster scanning speed and maximized tip life due to its frictionless operation.
References
1.J. Vella, et al., Mechanical properties and fracture toughness of organo-silicate glass (OSG) low-k dielectric thin films for microelectronic applications, International Journal of Fracture 119/120: 487–499, 2003.
2.M. Oyen, et al., A practical guide for analysis of nanoindentation data, J Mech Behav Biomed Mater. 2009 Aug;2(4):396-407. doi: 10.1016/j.jmbbm.2008.10.002. Epub 2008 Oct 15.
3.Y.Zhang, et al.,Review of research on the mechanical properties of the human tooth, Published online 2014 Apr 18. doi: 10.1038/ijos.2014.21.
4.https://www.parksystems.com/index.php/company/news/press-release/450-nanome chanical-mode-to-characterize-nano-mechanical
5.https://www.parksystems.com/index.php/products/small-sample-afm/park-nx10/overview
6.http://probe.olympus-global.com/en/product/omcl_ac160ts_r3/
7.https://www.brukerafmprobes.com/a-3724-ps-ldpe-12m.aspx
8.https://crest.com/en-us/products/whitestrips/crest-3d-white-monthly-whitening-boo st-whitestrips-teeth-whitening-kit
9.K. Chun, et al., Comparison of mechanical property and role between enamel and dentin in the human teeth, Published online 2014 Feb 6. doi: 10.1177/1758736014520809
10.C. Pinto, et al., Peroxide bleaching agent effects on enamel surface microhardness, roughness and morphology, Braz. oral res. vol.18 no.4 São Paulo Oct./Dec. 2004.