


Brian Choi, Bio-application scientist
For more information, please contact app@parksystems.com
Sample courtesy: Dr. Muhanna, King Abdulaziz City for Science and Technology
This is the first report of a living cell’s plasma membrane transformation monitored in three-dimensional cell morphology, measured by scanning ion conductance microscopy (SICM). Enabling the quantitative physical and structural characterization of living cells, which is not possible with other microscopic technologies, will enhance the work of bio-researchers with higher repeatability and reliability to the degree that they can understand the fundamental mechanisms of cellular membranes and explain cell-to-cell interaction more easily and effectively.
- Noninvasive imaging in sequence allows quantitative cell analysis and monitoring cell membrane withdrawal
- Measure the velocity of membrane transformation and membrane holes volume changes
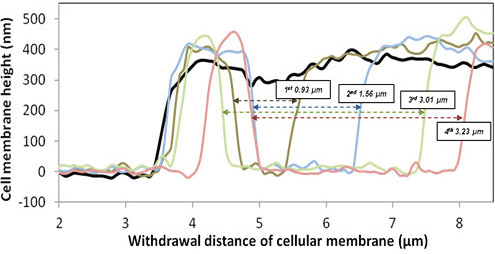
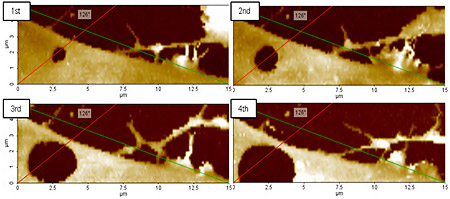 Live cell membrane transformation monitoring
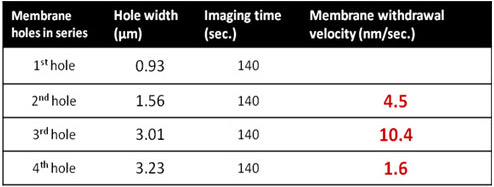
Measuring at the same position of the images (height information from red line), the membrane hole size was measured as 930nm in the 1st image. The hole increased in size to 1560nm and then to 3010nm. Finally, as shown in the 4th image, hole size grew to 3230nm. By calculating the cellular membrane’s morphological changes with respect to imaging time, the membrane’s movement velocity could be analyzed quantitatively, as shown on the right. The greatest velocity of cellular membrane motion was 10.4nm/sec. during the hole size change between the 2nd and 3rd images.
Live Cell Membrane Hole's Volumetric Analysis
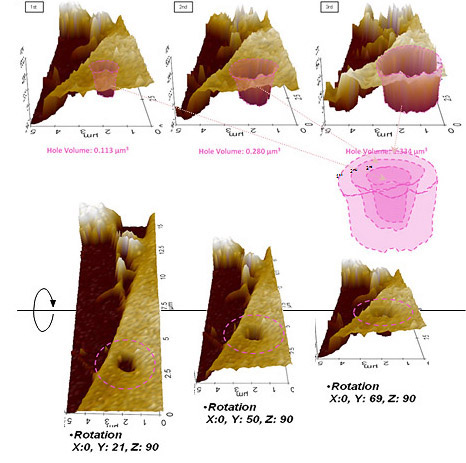
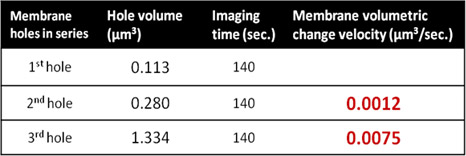
Three-dimensional volume calculations of each hole allow measuring volumetric changes in velocity of the cellular membrane, which is only obtainable from a 3D cell image, as taken by SICM. In the 1st image, the volume of the hole was measured as 0.113μm3. The size increased to 0.280μm3 in the next image, from which the velocity of membrane volumetric change was estimated as 0.0012μm3/sec.In the next hole volume change from 2nd to 3rd, the velocity was about seven times faster (0.0075μm3/sec.) than during the previous imaging interval.
Park Cell Analysis Systems
|
|
|
|
| Park NX12-Bio | Park NX10 | Park XE7 | |
| Scanning Ion Conductance Microscopy (SICM) | |||
| Atomic Force Microscopy (AFM) with liquid probe hand | |||
| Inverted Optical Microscopy (IOM) | |||
| Live Cell Chamber |