


In Electrolyte Solution Topography Imaging of Various Organic Samples using Park NX10 Scanning Ion Conductance Microscopy
Mina Hong, Gerald Pascual, Byong Kim, and Keibock Lee
Technical Marketing, Park Systems Inc., Santa Clara, CA, USA
Introduction
In order to identify and understand the root cause of a problem then develop an appropriate countermeasure, it is sometimes necessary to characterize a sample in situ. Several cutting edge applications follow this necessity such as: 1) the study of failure mechanisms in battery electrodes, 2) the study of membrane transport of ions between cells, and 3) the study of static and dynamic biomechanics at the cellular level. Common to all these applications is the need to perform in situ measurements of a sample experiencing a phenomenon while in an electrolyte solution. Techniques such as Atomic Force Microscopy (AFM) have been used for inliquid imaging of samples before, but AFM cannot be considered an ideal solution. Organic samples in particular have a tendency to soften and swell when immersed in liquid, increasing their likelihood of being damaged by an AFM tip. Furthermore, even the slightest motion of an AFM probe can cause a wet sample to sway and change position during scanning. Since the challenges of a wet sample are not easily met by a technique requiring direct probe-sample contact, an alternative to AFM is desirable. Fortunately, this need has been filled with the development of Scanning Ion Conductance Microscopy (SICM) and a new instrument: the Park NX10 SICM system. In SICM, sample topography is acquired by regulating the ionic current flowing through the opening of a glass pipette as it moves across a sample surface, all while in an electrolyte solution. This mechanism is completely non-invasive as it applies no pressing force onto a sample. Doing so overcomes AFM's limitations with soft and delicate wet samples and avoids the possibility of accidentally swaying a sample in an in-liquid setup.
Experiments
The Park NX10 SICM is based on the Park NX10 AFM platform. The hardware is virtually the same with the exception of an SICM head replacing the standard AFM head on the system. Instead of using an AFM tip to sense the interaction force between the tip and the sample then image the sample topography, the SICM head uses a either a glass pipette with an inner diameter ranging from 80-100 nm or one made of quartz with an inner diameter of 30-50 nm. The pipette is filled with electrolyte solution and connected with an Ag/AgCl electrode while another electrode is connected with the sample in liquid (Figure 1a). A closed circuit forms and with an applied bias between the two electrodes, the ionic current flows from the pipette to the sample (Figure 1b). When the pipette gets closer to the sample, the current decreases and the current-displacement relationship (Figure 1c) is tracked by the system's fast and accurate feedback loop. When the pipette truly touches the sample surface, the current will drop to zero. The degree of current decrease can be used to back calculate the surface topography. The pipette scans the surface at a given current set-point (normally 99%), which means it always keeps a few hundred nm away from the surface. Quite similar to Scanning Tunneling Microscopy (STM), which takes advantage of the tunneling current to characterize the materials surface, SICM keeps track of the current change to provide not just non-contact, but no-force imaging. In addition, it completely gets rid of cantilever tuning which can add complexity to non-contact in-liquid AFM imaging. This technique not only provides remarkably stable imaging and quantitative data, but also makes the observation of extra soft or sensitive biological materials, such as live cells, at nanoscale possible.
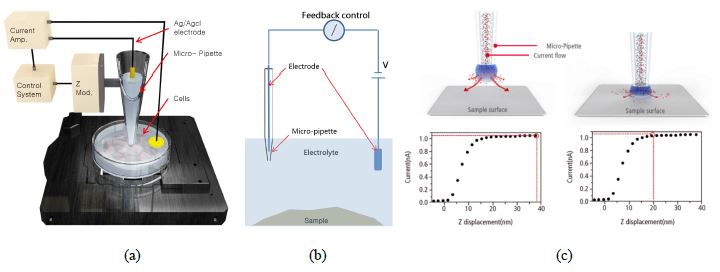
Figure 1. The snapshots showing the (a) SICM hardware setup, (b) circuit mechanism and (c) current-distance relationship between the pipette end and the sample surface.
There are two types of modes in SICM imaging. The first is called approach-retract scan (ARS) mode. This mode is widely applied to samples with features higher than 1 μm. Due to the high variation in height, the pipette may easily break if used doing a continuous scan on such samples. Instead, in ARS mode, it approaches the sample until reaching the set-point and fully retracts to a pipette-safe position before moving on to scan for the next pixel in the image. The approach and retract processes are repeated at each pixel of the image to be generated until it finishes the whole scan. The second mode is called direct current (DC) mode. This mode is mainly for samples with features that are within a few hundred nm in height. The pipette continuously scans on the surface at a given current set-point, meaning that the pipette-sample surface distance is fixed.
RESULTS & DISCUSSIONS
In order to show the ease of use and accuracy of SICM, we picked three representative samples, polydimethylsiloxane (PDMS), a polycarbonate membrane with 400 nm pores, and collagen fibrils. DC or ARS mode was chosen according to the materials' properties.
Polydimethylsiloxane (PDMS): PDMS was primarily chosen for imaging as it is a material used to create standards for SICM system calibrations. That said, it should also be noted that PDMS is also used in contact lenses. In situ investigations of PDMS can give us insight into how it behaves in targeted application environments. With contact lenses one such environment would be the surface of the human eye which is regularly moistened by basal tears, a biological lubricant containing electrolytes.
Two PDMS standard samples with different geometries provided by Park Systems were imaged. One is the XY square shaped grid, pitch size 10 μm and the other one is the 117.5 nm high bar shaped grid. Phosphate-buffered saline (PBS) standard solution from Thermo Fisher Scientific was used as the electrolyte solution.
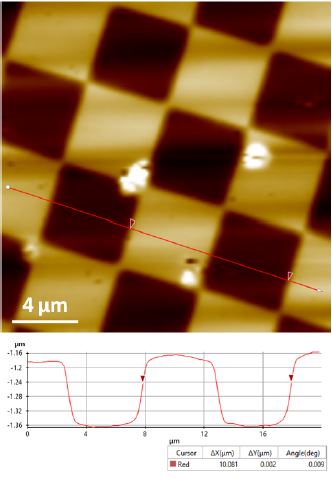 Figure 2. Topography image of the XY standard sample acquired by DC mode. Scan size 20 μm × 20μm.
Image size 215 px × 215 px.
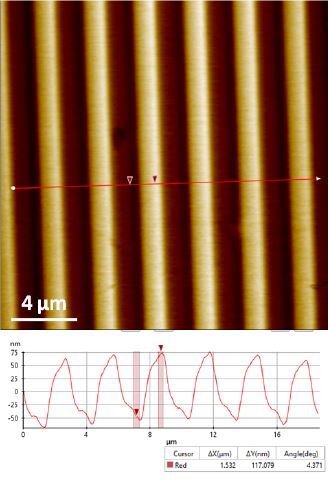
Figure 3. Topography image of the XY standard sample acquired by (DC mode. Scan size 20 μm ×20 μm.
Image size 256 px × 256 px.
Figure 2 and 3 show the topography images acquired by DC mode of the XY and Z standards respectively. These images successfully exhibit unambiguous and high contrast surface features. The XEI image processing software from Park Systems was used to do all image post-processing including quantification analysis. For the XY standard sample, the 10 μm pitch-to-pitch distance and ~160 nm grids height are accurately revealed (Figure 2). For the Z standard sample, the height information recovered from DC mode is quite close to the desired value of 117.5 nm.
Poretics polycarbonate membrane: Nanopores refer to holes with the size of tens to thousands of nanometers that exist in thin membranes. Due to the penetration of molecules or proteins through the pores, the membranes can be powerful sensors of molecules and ions, and this property is applied in a variety of fields including engineering, chemistry, biology, medicine, and so forth. Recent advances in nanotechnology can precisely control the morphology as well as physical and chemical properties of the pores to make them increasingly attractive for regulating and sensing transport at the molecular level [1]. In addition, with certain chemical modification, nanopore membranes can be used for high-throughput nanoparticle separation or filtration [2, 3]. Extensive research was also carried out in the fabrication, characterization, and modeling of nanopore membranes. Traditional AFM typically relies on the interaction forces between a probe tip and the sample surface. However, it is not sufficient enough to test the sharp geometry of a sample membrane surface or the ionic transportation through its pores. SICM has proven to be a powerful technique in accomplishing both [4, 5].
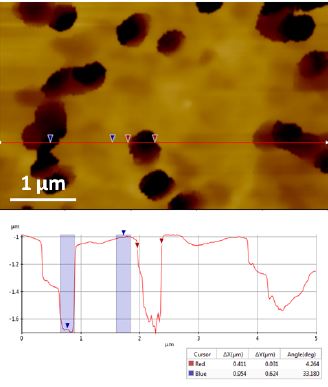 Figure 4. Topography images of 400 nm diameter pore polycarbonate membrane recorded in PBS solution with SICM ARS mode. The average pore depth is ~ 600nm.
We tested the poretics polycarbonate membrane with 400 nm pores supplied by GE Water & Process Technologies in PBS solution with SICM. The membrane was put on PDMS substrate for imaging. In order to prevent the pipette from being damaged by the deep pores, we only ran ARS mode on this sample. Figure 4 exhibits the pore sizes acquired by SICM. The data reveals the pores have an average diameter of about 416 nm and an average depth of about 600 nm. Indeed, more advanced work with this type of sample has been done such as identifying the transport activity of individual pores [4, 5].
Collagen fibrils: Collagen fibrils are a widely accepted standard sample for measurements of biological and soft material properties. Like many biological samples, these fibrils soften and swell once rehydrated and can sway if disturbed with an AFM probe. This third sample, provided by our collaborators at Niigata University in Japan, allows us to demonstrate SICM's capability to image a sample whose nanoscale topography would otherwise be difficult to acquire with other microscopy techniques.
The collagen fibril was cut and spin-cast on a petri dish and imaged with a Park NX10 system in PBS solution with SICM. Due to the height variation of collagen fibrils, we applied ARS mode only. The XEP software was used to run all the tests. As shown in Figure 5, the protein bundles as well as each individual fibril can be clearly identified in the 10 μm sized images at a 256 x 256 pixel resolution. The thinnest fibril SICM can distinguish (indicated by the black arrow) is only about 90 nm in width. Based on the fact that there is no real contact or force between the end of the pipette and the sample surface, this resolution is quite impressive.
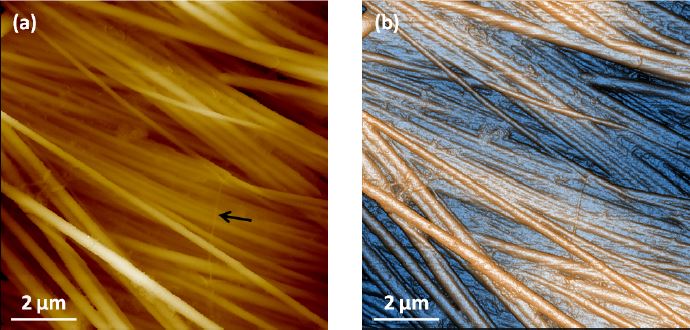
Figure 5. (a) Topography and (b) contrast enhanced topography images of collagen sample imaged in PBS solution with SICM ARS mode. Individual fibril can be clearly identified and the thinnest one observed is about 90nm in width, as pointed by the black arrow. Scan size 10 μm ×10 μm. Image size 256 px × 256 px.
Summary
The topography images of all three samples were acquired efficiently and accurately in buffered solution using the Park Systems NX10 SICM. This innovative technique completely overcomes problems in traditional in-liquid AFM investigations and provides a no-force solution ideal for all materials, especially soft and sensitive ones. With the easy use and high performance of SICM, it can successfully provide researchers with high quality in-liquid images to help them better understand performance of their samples in various solutions at nanoscale.
REFERENCES
1. Adiga, S.P., et al., Wiley Interdiscip Rev Nanomed Nanobiotechnol, 2009. 1(5): p. 568-581.
2. Anmiv, S.P., et al., J. Phys. Condens. Matter, 2010. 22(45): p. 454107.
3. Tokarev, I. and S. Minko, Adv. Mater, 2010. 22(31): p. 3446-3462.
4. Chen, C., Derylo, M.A. and Baker, L.A., Anal. Chem., 2009. 81(12): p.4742-4751
5. Zhou, Y., Chen, C. and Baker, L.A., Anal. Chem., 2012. 84: p.3003-3009
ACKNOWLEDGMENTS
We would like to thank Ms. Wenqing Shi and Prof. Baker Lane from University of Indiana for providing the nanopore polycarbonate membrane samples and fruitful discussions of SICM.