


By Ardavan Zandiatashbar, Park Systems Inc., Santa Clara, California.
ABSTRACT
Nano-scale surface roughness measurement has been one of the most common applications of atomic force microscopes over the past two decades. Roughness measurement accuracy and repeatability along with tip life are the major factors that had been considered to be almost impossible to coexist. In this article, we review the basics of non-contact (attractive) mode imaging and introduce soft dynamic mode for special sub-angstrom level roughness measurement applications. The effects of using soft dynamic mode on tip life, measurement consistency and tip-to-tip correlation have been investigated. It is found that soft dynamic mode could be the solution for samples with sub-angstrom surface roughness covered with liquid layer.
INTRODUCTION
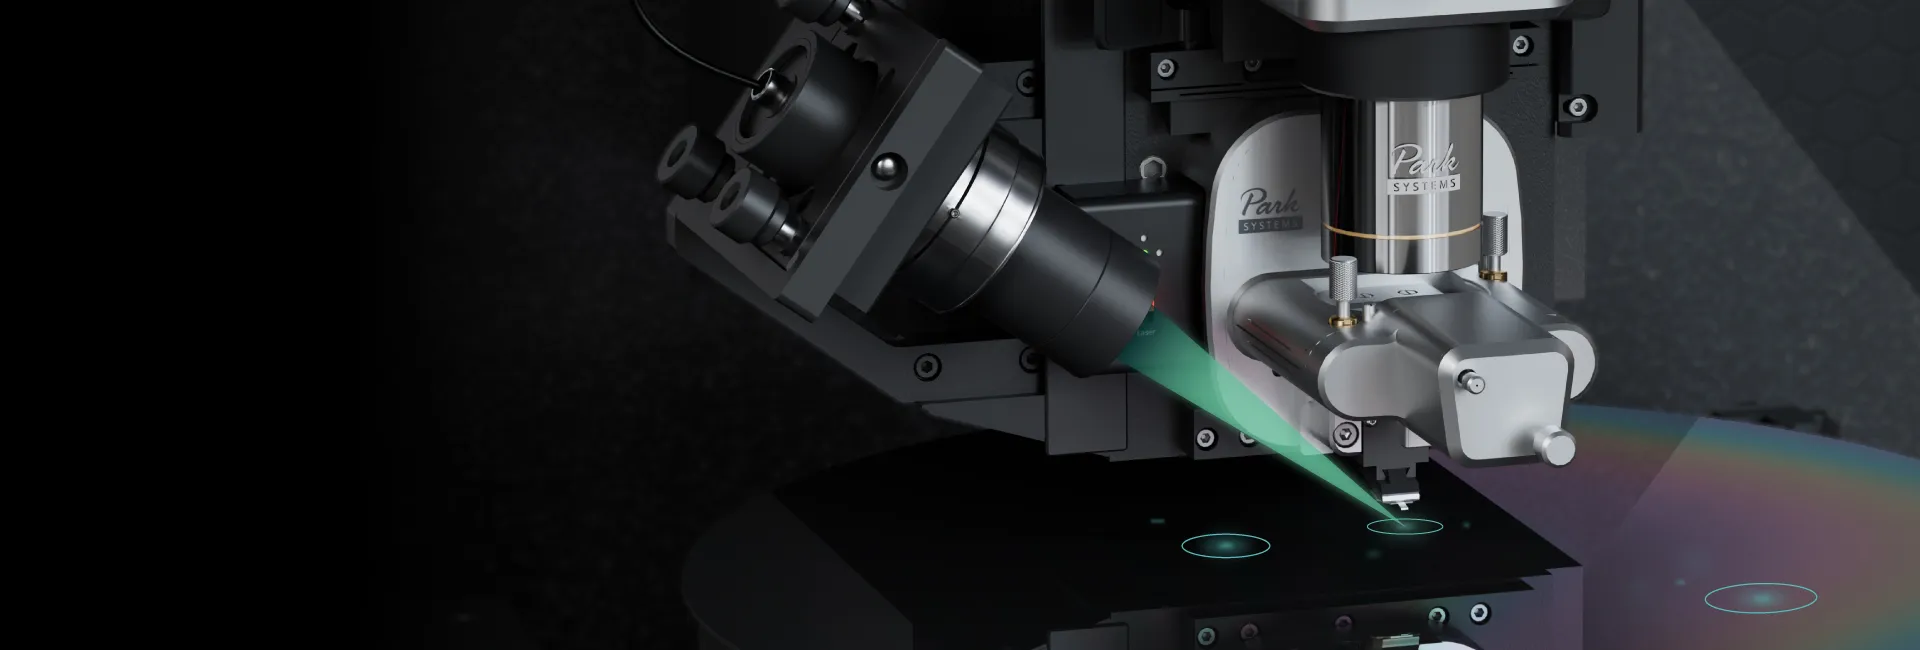
Characterization of nano-scale surface roughness and statistical properties of surfaces for different materials is known to be one of the most common applications of scanning probe microscopy (SPM) both in research and production. As an example for SPM application in industrial research and development, surface roughness measurement is required for quality control of glass media samples or heat-assisted magnetic recording (HAMR) products in data storage industry. On the other hand, surface quality control after chemomechanical polishing (CMP) is key factor in determining the reliability of final products in semiconductor production. Nanometer scale roughness of production wafers is important for device patterning in integrated circuit (IC) manufacturing. In all of these applications, understanding the physical property of the sample surface at nano-scale is essential to maintain the reliability and understand failure mechanisms in final products. Atomic force microscopy (AFM) plays a key role in nano-scale surface roughness measurement due to its sub-nanometer level resolution in Z direction. Non-contact (NC) mode or attractive state oscillation imaging has been essential for preserving tip life and consistency in measurements. Although NC mode was the first dynamic force microscopy mode [1], lack of high bandwidth Z-actuator made it difficult to maintain the tip consistently in attractive state. Therefore repulsive state oscillation was used as an alternative which is also known as dynamic mode. Dynamic mode is usually used with high oscillation amplitudes, which leads to limited tip lifetime. Consequently, the data measurement lacks repeatability as it relies heavily on the tip sharpness. Using blunt tips affects significantly the surface roughness measurements as the surface feature size become comparable to or smaller than effective tip radius. Park Systems pioneered manufacturing commercial AFM systems with the focus on performing non-contact mode imaging with high bandwidth Z-actuators and decoupled Z and XY scanners. Here we explain the advances made in AFM imaging for subangstrom surface roughness measurement and repeatability using Park NX system.
DISCUSSIONS NON-CONTACT VS. DYNAMIC MODE
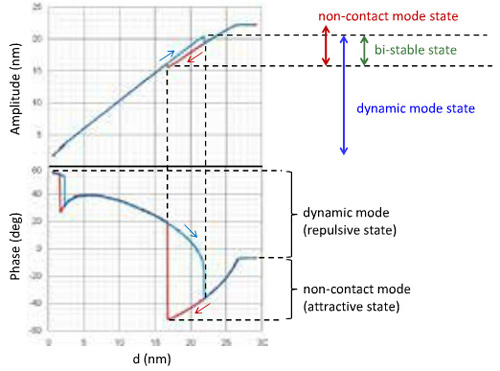
To perform amplitude modulation non-contact mode imaging, the frequency of the cantilever oscillation should be selected slightly larger than the resonance frequency of the cantilever. This frequency selection is based on the fact that the cantilever resonance frequency increases when the cantilever oscillates in attractive state based on the tip-sample separation. In this state, the phase of oscillation for a sharp clean tip is negative in the AFM systems manufactured by Park Systems. (The actual value and sign of the phase signal varies depending on system manufacturer). While Z stage is approaching the sample surface, the cantilever oscillation amplitude is affected by tip-sample interaction forces. This behavior can be observed in Figure 1. In this figure an experimental amplitudedisplacement (A-d) curve is shown. In this curve the oscillation amplitude is measured as the tip approaches towards and then retracts from the sample surface. While the tip-sample separation decreases (red curve), the tipsample interaction is in attractive state (NC mode) until a jump in amplitude occurs and tip-sample interaction transitions to repulsive state (dynamic mode). Similarly when the tip is retracting from the surface (blue curve), it suddenly switches from repulsive to attractive state. As a rule of thumb, this transition generally happens when the tip-sample separation is almost between half to three quarters of free oscillation amplitude of cantilever. This transitional behavior between NC and dynamic modes can be seen as a hysteresis loop in the plot and creates a bistable state [2]. In this state, the feedback system becomes bistable. A corresponding hysteresis loop can be observed in the phase curve as well. In the phase hysteresis loop, phase values transition between negative (attractive state or NC mode) and positive values (repulsive state or dynamic mode).
TIP SHARPNESS BASED ON A-D CURVES
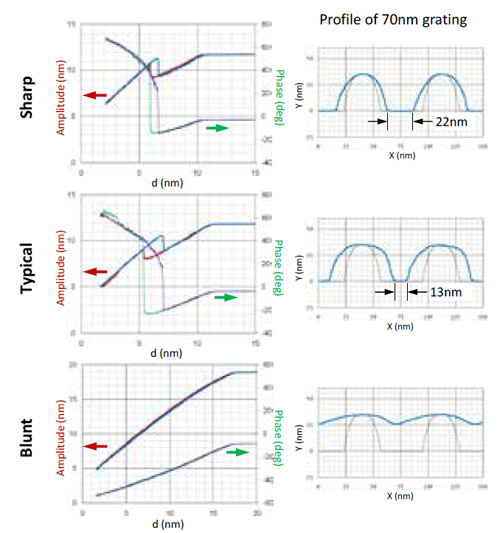
The amplitude curves can be affected by tip sharpness as well. Figure 2 shows three sets of amplitude and phase curves representing sharp, normal, and blunt tips. The tip sharpness is verified by scanning a 70 nm grating. As the tip loses its sharpness, its ability to precisely resolve the gratings becomes limited, while the attractive state region becomes slightly wider. For a normal tip it is easier to maintain the tip in attractive state as this state is wider. For a blunt tip, the amplitude and phase curves do not include the bistable state hysteresis loop, and phase can reach large negative values. In fact, Figure 2 shows that amplitude curve can be used as an estimated tip sharpness/quality characterization tool.
DYNAMIC MODE BENEFITS AND LIMITATIONS
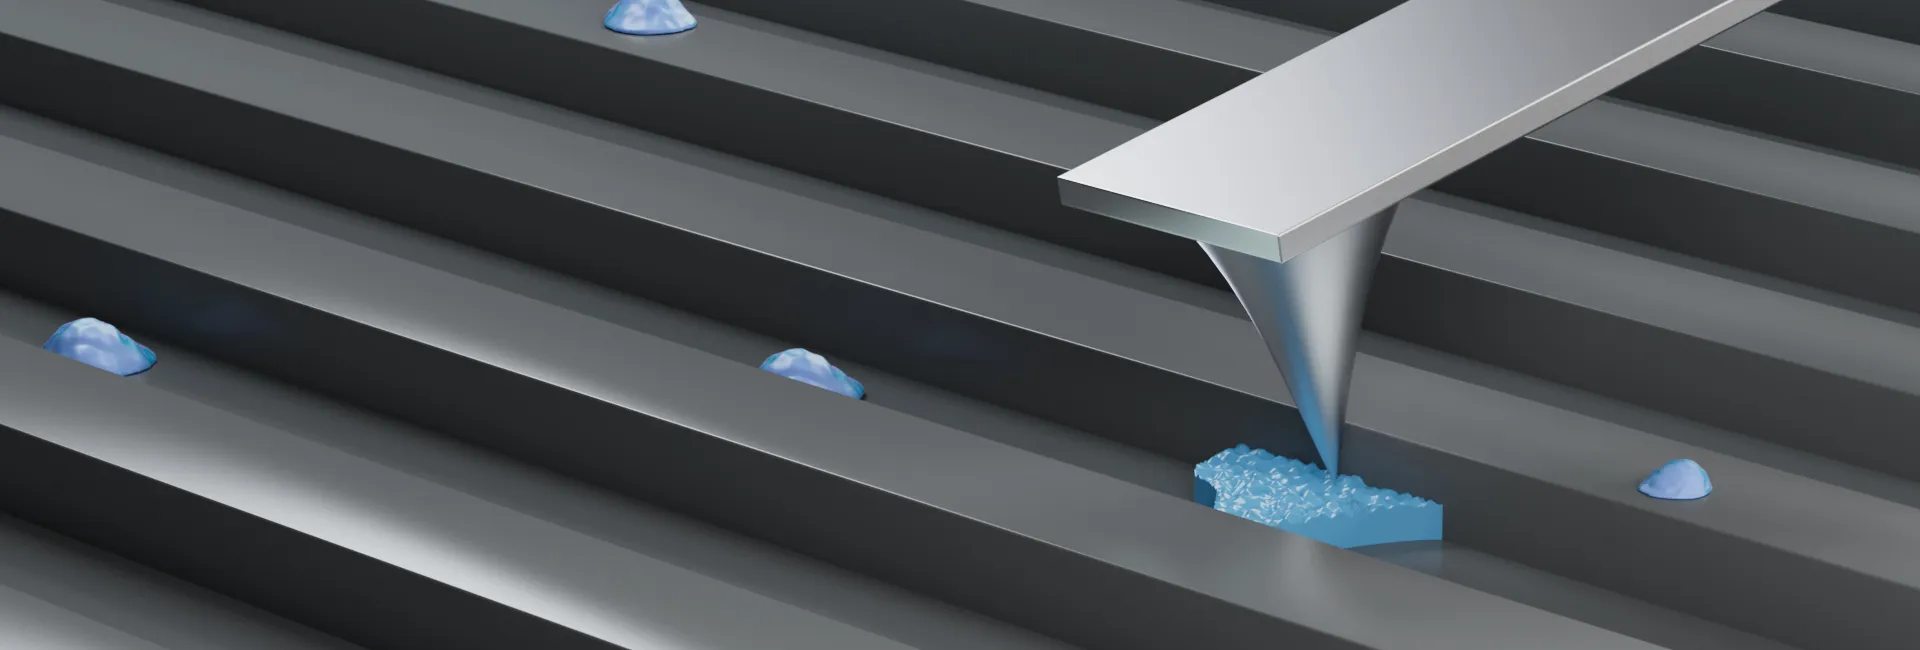
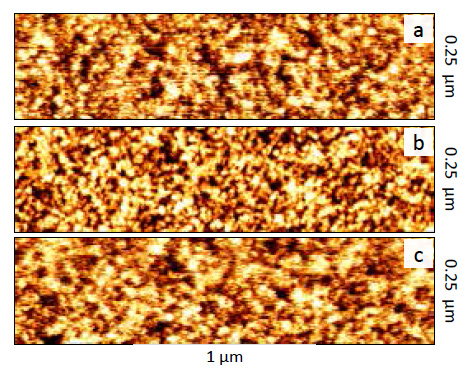
NC mode imaging has the benefits of preserving tip life and measurement consistency, and has been very helpful in measurement of sub-angstrom level roughness values, for example for bare silicon wafers. However, in some cases its performance may be limited when measuring samples with small roughness values (<2Å). In these cases, the image loses resolution and has poor quality. This could be attributed to the presence of liquid layer on top of the sample surface. If the thickness of the liquid layer is comparable to the feature size, it does not allow the tip to track the surface features accurately in attractive state. In order to overcome this issue, tip needs to oscillate in repulsive state. This way it can penetrate the liquid layer and reach the sample surface (contact). This phenomenon is demonstrated by imaging a hard drive glass media sample using both NC and dynamic modes in Figure 3. In this image the sample was initially imaged using the NC mode with the cantilever oscillation amplitude of 10 nm. Despite the acceptable sharpness of the tip, the image quality is not desirable. Sample was imaged again using dynamic mode (with oscillation frequency smaller than the free air resonance frequency (f0)). The dynamic mode image has better quality than the initial image. In the 3rd scan, the sample was imaged in NC mode by using cantilever oscillation frequency larger than f0 and inability of the tip reaching the sample surface was confirmed.
SOFT DYNAMIC MODE
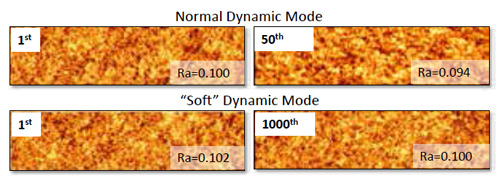
Conventionally dynamic mode imaging is performed with large amplitude oscillation (>20 nm). The larger amplitude oscillation is enabled by applying more energy to the cantilever which facilitates the tip ability to “contact” the sample surface. In addition, the AFM systems ability to perform dynamic mode imaging with low oscillation amplitude was limited due to the bandwidth of the Z servo of the AFM system and system noise level. If a system can perform dynamic mode with low amplitude, it should be able to apply minimum energy to the cantilever, just enough to penetrate the liquid layer, then the tip life may be preserved longer and minimize its effect on the measurement repeatability. Park NX series were designed for low amplitude NC mode imaging, hence it is made possible to perform low amplitude low energy cantilever oscillation with maximum signal to noise ratio. We call this type of dynamic mode (with low oscillation amplitude) soft dynamic (SD) mode. Figure 4 shows a comparison between the tip life in normal dynamic mode (high amplitude) vs. SD mode (low amplitude) by scanning a glass substrate sample with roughness value of about 1Å. In this figure, the 1st and 50th scanned images by normal dynamic mode are compared. The 1um x 0.25um images (512 x 128 pixels) are collected with scan rate of 1Hz. The roughness value (Ra) is decreased by 6% over 50 images and image resolution significantly degrades due to loss of tip sharpness. The two lower images show the comparison between 1st and 1000th images collected with same tip using SD mode. The decrease in roughness value is below 2% over 1000 images, and high image resolution is well-preserved until the last image. Performing SD mode imaging is made possible by using fast Z servo feedback. Despite the gradual tip wear, SD mode clearly outperforms normal dynamic mode in terms of tip life and measurement consistency.
TIP TO TIP VARIATION AND TIP LIFE
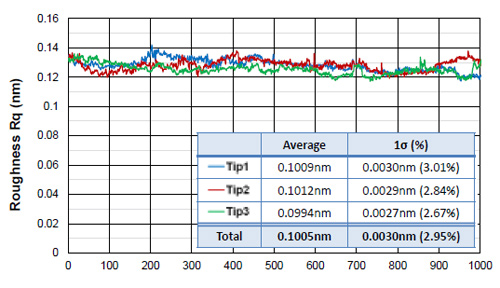
Another important factor about measurement consistency is tip-to-tip correlation. It is desirable to eliminate tip dependency of the measurements in order to obtain true sample surface property by AFM roughness measurement. For this purpose, the 1000-image roughness measurement test was repeated with three different tips. Variations of roughness (Ra) over 1000 scans for the three tips are shown in Figure 5. The average and standard deviation of the data set for each tip is shown in the inset table. It can be seen that for the sample with Ra of 1Å, the repeatability measurements show variations below 0.03Å (below 3%). This minimal variation shows tip independency of roughness measurements using SD mode.
SAMPLE VARIATIONS
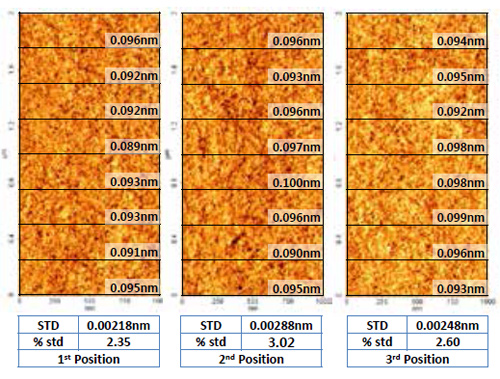
Although the measurement variation is small (<3%), the source of the variation still remains unknown. Figure 6 shows three sets of roughness measurement on different positions on the HDD glass media. At each location, 1um x 2um images with resolution of 512 x 1024 pixels are collected at scan rate of 1Hz in SD mode. Each image is divided to eight 512 x 128 pixel sections in order to be comparable with images collected for Figure 5 and Ra values were measured for each subimage. It turned out that the Ra variation on the sample surface from location to location is around 3% which is comparable to the variation observed in Figure 5. Therefore, one possible source of the 3% variation observed in Figure 5 could be attributed to point to point variation on the sample surface.
CONCLUSION
In this article we introduced SD mode imaging as an alternative method for subangstrom surface roughness measurement by using low amplitude low energy cantilever oscillation with Park NX series. We performed 1000 roughness measurements using one single tip using SD mode and showed less than 3% variation while the image resolution and tip sharpness is preserved. This variation is identical to the variation of roughness over different locations on the sample surface. By repeating the 1000 scan test using two additional tips, significant tip-to-tip correlation with 3% variation was shown to exist. Performing SD mode imaging is made possible by using large bandwidth and high speed feedback system provided on Park NX series. This solution is provided for research and production in different industries including hard drive media and semiconductor manufacturing.