


| Part 1 | Imaging of Plasmids in Liquid using True Non-Contact Mode Atomic Force Microscopy |
| Part 2 | A Practical Guide of DNA Imaging in Liquid with Park NX10 |
Imaging of Plasmids in Liquid using True Non-Contact Mode Atomic Force Microscopy
John Paul Pineda, Gerald Pascual, Cathy Lee, Byong Kim, and Keibock Lee
Park Systems Inc., Santa Clara, CA, USA
INTRODUCTION
Deoxyribonucleic acid (DNA) is one of the most significant discoveries of the last century, primarily because it revolutionized many fields including genetics, molecular biology, medical research, agriculture, forensic science, and many others. DNA is a biological molecule that acts as the storage of genetic information essential for bodily function, growth, and the reproduction of all living organisms. This information is located in the nucleus of every cell in an organism and can be transmitted not only from one cell to another but also from parents to offspring. Hence, knowledge on the structure of DNA is very valuable in understanding how the transfer of genetic information occurs.
Several techniques have been used in studying the structure of DNA, one of which is electron microscopy (EM). However, several issues on sample preservation have arisen with this technique due to its tedious sample preparation requirements. As a result, the atomic force microscope (AFM) was developed to overcome such shortcomings. AFM’s capability to image samples under in-liquid conditions preserves the condition of biological samples and provides higher quality high-resolution images [1]. The True Non-Contact imaging mode of AFM tools from Park Systems allows for the measurement of sample topography without requiring a tip-sample interaction that can lead to sample damage and tip degradation. Thus, this mode is preferred when measuring samples that are sensitive to surface deformation rather than conventional contact and tapping modes. The advanced Z scanner design of a Park AFM is the key feature in achieving the non-contact imaging performance that defines Park’s True Non-Contact mode: the highest imaging resolution and most accurate topographical data whilst maintaining tip sharpness and minimizing the chance of damaging the sample surface [2].
EXPERIMENTAL
A 45 ng sample of plasmids (a type of small DNA molecule) was dispersed on a mica substrate and imaged with a Park NX10 AFM under in-liquid conditions using True Non-Contact mode. A cantilever with a relatively low nominal resonance frequency of 110 kHz and a nominal spring constant of 0.09 N/m was utilized in this experiment.
The non-contact AFM image is acquired by measuring the changes in the vibrational amplitude of the cantilever induced by the attractive van der Waals force as the cantilever is mechanically oscillated near its resonant frequency during the scan. The measured changes are compensated for by the AFM’s feedback loop which maintains the cantilever’s constant amplitude and distance. Non-contact mode measures the topography of the sample surface by using this feedback mechanism to control the Z scanner movement [2]. In liquid conditions, the cantilever’s resonant frequency decreases by 1/3 of its original value in air due to dampening effects; a similar decrease is observed in its amplitude as well. In addition, multiple peaks can also be observed on a frequency sweep in liquid—fewer fluctuations are observed in air. Thus, the appropriate resonant frequency was chosen before the measurement procedure by selecting the highest peak near the region around 1/3 of the original resonant frequency and the amplitude was set to around 0.9 nm. The feedback system of the AFM uses a superluminescent diode (SLD) beam reflected from the cantilever. However, due to the instability of the liquid surface during measurement, the reflected SLD beam will scatter. For this reason, a liquid probehand with shielded glass was designed by Park Systems to avoid this problem. This type of probehand was utilized in the experiment.
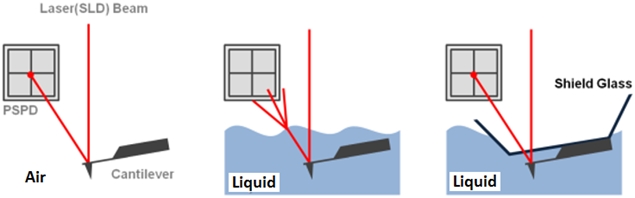 Figure 1. The feedback mechanism of True Non-Contact mode AFM in air and in liquid scan conditions. The shielded probehand in the rightmost image demonstrates its utility in maintaining optimal SLD beam and PSPD performance.
RESULTS & DISCUSSION
A high resolution image of the plasmid sample was successfully acquired and processed using XEI software developed by Park Systems. The sample was expected to consist of uniform linear plasmids. However, the topography data in Figure 2 revealed that the 1 by 1 um scanned region contains a mixture of linear and supercoiled plasmid DNA strands. The strands with larger structures are marked with green arrows and exhibit a supercoiled appearance with diameters of approximately 19 nm while the strands with smaller, linear structures are marked with yellow arrows and appeared to be in a relaxed state with diameters of approximately 8 nm. It was also observed that the supercoiled DNA strands appeared to be longer when compared to the linear strands. The line profile that generated by XEI in Figure 3 provides the height information of DNA strands. The data shows the supercoiled strands have a height of 1.6 nm whereas the height of the linear strand was only 1 nm.
In its normal environment (cell nucleus), the DNA twist itself to overcome distortion as it is subjected to torsional stress during replication. A similar phenomenon could have happened in the linear DNA during this experiment. It is speculated that the linear DNA became supercoiled due to the torsional stress during sample preparation. The end of the plasmid possibly stuck to the substrate more tightly than expected, and as the DNA is subjected to torsional tension, the DNA twists around and bunches up on itself resulting to a larger and supercoiled structure with increasing orders of twisting [3].
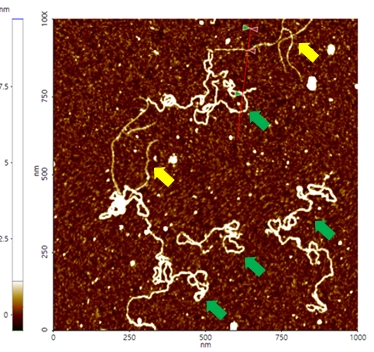 Figure 2. Non-contact mode AFM topography image of plasmids. The segments indicated with yellow arrows have linear structures whereas those with green arrows exhibit supercoiled structures. Scan size: 1 x 1 um.
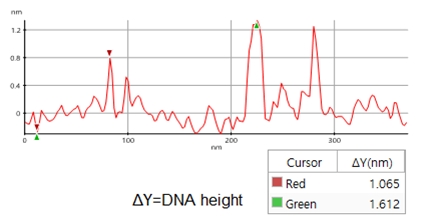 Figure 3. Line profile of non-contact mode AFM topography data taken from the sample shown in Figure 2. Red marker: smaller, linear DNA structure, green marker: larger, supercoiled DNA structure)
SUMMARY
The structure of a plasmid sample was successfully characterized by the Park NX10 AFM using True Non-Contact mode imaging under in-liquid conditions. The topography data revealed that the sample is characterized by the presence of DNA with two different superstructures: a linear configuration and a supercoiled one speculated to be due to torsional tension during sample preparation. One linear plasmid was revealed to have a width of 8 nm and a height of 1 nm. By comparison, one of the supercoiled plasmids had a width of 19 nm and a height of 1.6 nm. Overall, the technique described in this study will successfully provide researchers nanoscale information that is significant in monitoring the effects of structural damage and conformational change in DNA.
REFERENCES
[1] A. Baro, et al., Atomic Force Microscopy in Liquid: Biological Applications. Wiley-VCH, Pages 233-237.
[2] J. Pineda, et al., True Non-Contact Imaging of Various Samples, Retrieved January 12, 2017, from http://www.parkafm.com/index.php/medias/nano-academy/articles
[3] H. Hansma, et al., Reproducible Imaging and Dissection of Plasmid DNA Under Liquid with the Atomic Force Microscope, AAAS, Pages 1180-1181.
A Practical Guide of DNA Imaging in Liquid with Park NX10
Gordon Jung, Dan Goo, Performance Testing Team, R&D Center, Park Systems Corp.,
KANC 3F, Gwanggyo-ro 109, Yeongtong-gu, Suwon 16229, Korea
Introduction
How do an organism’s features endure across generations? The biological information that is needed for hereditary traits to be passed are inside genes. The basic units of heredity are made up of deoxyribonucleic acid (DNA) [1]. DNA stores hereditary information by using four nucleobases, adenine (A), guanine (G), cytosine (C), and thymine (T). The nucleobases pair up in sequence with a sugar-phosphate backbone holding them in a set order. This backbone also gives the DNA a negatively charged nature. With the nucleobases and the sugar-phosphate backbone in place, DNA naturally forms up in double strands connected in a right-handed double-helix structure. Generally, the width of of this structure is 2.37 nm and is called the B-DNA form (see Figure 1). Depending on the base pair composition, the width varies only a minor amount. Such features of DNA were first characterized by Watson and Crick’s using x-ray diffraction pattern data of DNA. Today, the topography of DNA can be obtained at nanoscale by using atomic force microcopy (AFM). It is important for medical, physical, and biological fields to observe and analyze such polymers in high resolution. DNA alteration or the loss of of a set DNA sequence can cause irregular translation of RNA resulting in the creation of abnormal proteins. These abnormal proteins in turn may result in catastrophic signal error in the body leading to any number of debilitating conditions. Therefore, it is essential to analyze structural variation of the DNA in molecular scale—doing so could help us understand the mechanisms of genetic diseases and potential treatments with more detail than ever before.
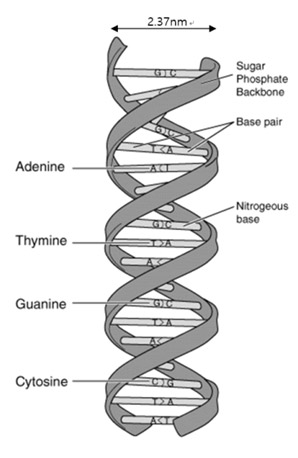
Figure 1. Structure of DNA double-helix molecule. DNA is composed of A-T and C-G base pairs that are connected by a sugar-phosphate backbone. The width of the double-strands B-DNA are generally measured to be 2.37 nm.
AFM can be used for DNA structure imaging. Visualizing DNA structure is impossible via optical microscopy as the resolution of such techniques is limited to approximately 0.2 micrometers. On the other hand, AFM has a lateral resolution of less than 0.1 nm and a vertical resolution of less than 0.01 nm. AFM is a powerful microscopy technique that can simultaneously acquire three-dimensional topography data and surface properties measurements of the given sample. Park Systems’ AFMs can image in aqueous environments as well in ambient air. Aqueous AFM imaging makes it possible to create a 3D image of biological samples under in-situ conditions. Another advantage of aqueous imaging is that as the tip and sample both are in aqueous environment which eliminates the probe capillary effects that reduce resolution and distort acquired images. Furthermore, Park AFMs are capable of acquiring time-lapsed 3D images, opening up the possibility of imaging crucial genetic processes such as transcription, replication, etc.
AFM imaging of samples under aqueous conditions requires additional control steps compared to the procedure for ambient air conditions. One must be cautious of selecting the resonance frequency during aqueous imaging. When the image is being taken in AC mode, there are few phenomena that must be taken in consideration: the shift and amplitude damping of the cantilever’s resonance frequency and the non- intrinsic peaks. The cantilever resonance frequency decreases to 1/2 to 1/3 of its initial value depending on the range of the spring constant and the amplitude of the cantilever’s resonance frequency decreases about 1/2 in aqueous condition compared to ambient condition. Also, non-intrinsic peaks will occur and these make it difficult to determine the resonance frequency in aqueous conditions. Therefore, the thermal tune method is used to select the correct resonance frequency [2]. Figure 3 describes the steps for the thermal tune method in aqueous conditions.
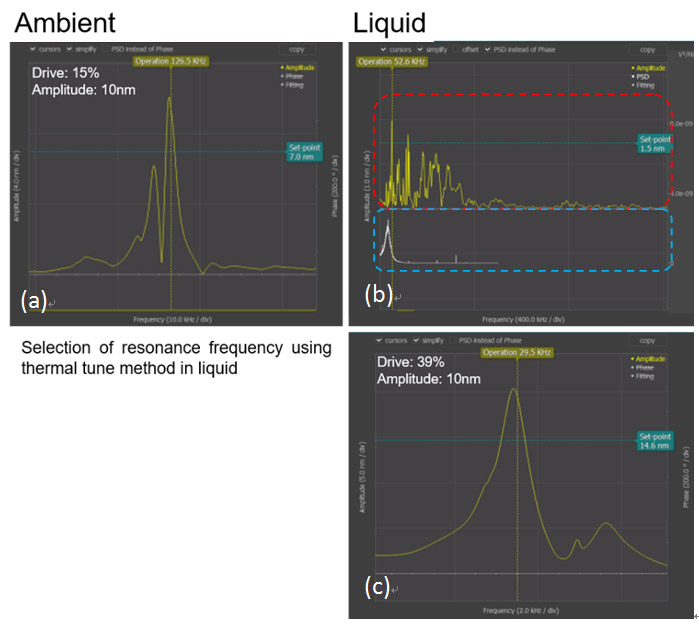
Figure 2. Resonance frequency selection using the thermal tune method. Thermal tune was performed under HEPES Buffer Solution with NiCl2. (a) Resonance frequency in ambient condition. (b) The upper red dashed box shows the overall resonance frequency of the tip and the lower blue dashed box shows the resonance frequency of the tip that is magnified by using thermal tune method in liquid condition. (c) Using the thermal tune method, the selected resonance frequency is displayed
Experiments
- pmaxCloningTM vector, Catalog No. VDC-1040
- Tris EDTA Buffer solution pH 8.0 from Sigma-Aldrich, Catalog No. 93283
- Mica substrate from Tedpella inc, Catalog No. 16209
- HEPES from Sigma-Aldrich, Catalog No. H3375
- Nickel (II) Chloride from Sigma-Aldrich, Catalog No. 339350
- pH meter
- 0.02 μm syringe filter from Fisher Scientific, Catalog No. Z747637
- Milli-Q water with 18mOhms
A DNA vector (Lonza, pmaxCloningTM, VDC-1040) was used as the DNA sample. It is a plasmid which promotes eukaryotic gene expression of cloned DNA inserts (2.9 kb in size) in mammalian cells. The sample was treated in Tris EDTA Buffer (Sigma-Aldrich, TRIS EDTA BUFFER SOLUTION PH 8.0, 93283) solution to transform its morphology into a more extended form [3]. Mica (TED PELLA INC., 16209) was used as the base surface substrate where the DNA was attached for AFM imaging (see Figure 3). It should be noted that mica is one of the most commonly used AFM substrates that retain water molecules.
Special preparation of the DNA sample, namely its fixation onto the mica substrate, is required for successful AFM imaging in aqueous condition. In ambient air conditions, a dried DNA sample can be simply sprinkled on top of a newly cleaved mica substrate prior to AFM imaging. However, in aqueous conditions, successful imaging of DNA in aqueous condition requires additional preparation. If DNA is submerged in deionized water, it tends to float around. Even if the DNA were to eventually sink on top of the mica substrate, the two do not form a strong enough bond to allow for AFM imaging.
As mentioned earlier, DNA has a negative charge nature due to its sugar-phosphate backbone and the mica substrate also has a negative surface charge as well. This makes is difficult for the DNA sample to adhere to the mica substrate. Other studies have shown that divalent cations, such as Mg2+, Zn2+ etc., were used as a bridge to attach the DNA sample to the surface of the mica substrate [4]. One such divalent cation, Ni2+, was used in this sample preparation. According to Cheng, Nickel(II) shows strong affinity relationships with DNA, while widely used Mg2+ does not [5].
To maintain the pH of the aqueous environment, HEPES buffer solution was used. This solution can provide a range of pH values from 6.55 to 8.55. Maintaining the solution’s pH is important as DNA denaturation occurs when the solution is either acidic or basic [6]. Therefore, an aqueous solution of 10 mM HEPES buffer with 1 mM Nickel(II) chloride was used [7].
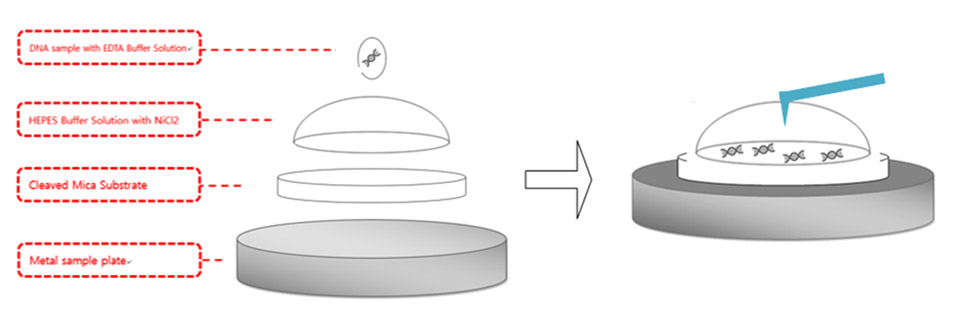
Figure 4. DNA sample preparation diagram. pmaxCloning was used for the DNA sample and mica substrate was used for the surface where the DNA was applied and the AFM imaging was performed. Mica substrate was attached to the metal plate, which is magnetically fixed to the AFM stage. 300μl HEPES buffer solution with NiCl2was applied on the surface of mica surface and formed a hemisphere. 5 μl of DNA was applied above the hemisphere.
As described in Figure 4, 300 μl of the aqueous solution was applied above the newly cleaved mica substrate and formed a hemisphere bubble. A concentration of 50 μl pmaxCloning vector with a concentration of 0.5 μg/mL was applied above the bubble and incubated in room temperature for 30 mins. After waiting 30 mins for the DNA to attach to the mica substrate with a strong enough bond, the AFM laser alignment using a shielded liquid probe hand was performed. As stated above, the resonance frequency of the tip decreases drastically as the tip is submerged into aqueous environment. Therefore, the thermal tune method was performed to find the proper resonance frequency. A cantilever with a low spring constant, such as 0.09 N/m, was used to avoid sample damage in case of physical contact between the tip and the sample. Once the proper resonance frequency is determined, tip approach to the sample was performed with an amplitude of 15 nm, which is the usual value used for tip approach in ambient air conditions. AC mode was run with lower amplitude compared to the initial value after the tip completed its approach to the sample.
Results and Discussions
Figure 5 shows the results of the plasmid DNA imaging in aqueous solution using AFM. The double strand structure of the DNA was clearly visible and zooming into the image showed further detail of the DNA. The distribution of the DNA on the mica substrate showed that the concentration applied was sufficient. Additional 3-dimensional structure data of the DNA was also acquired. The results show that the height of the DNA was approximately 2 nm, which is in line with the expected value.
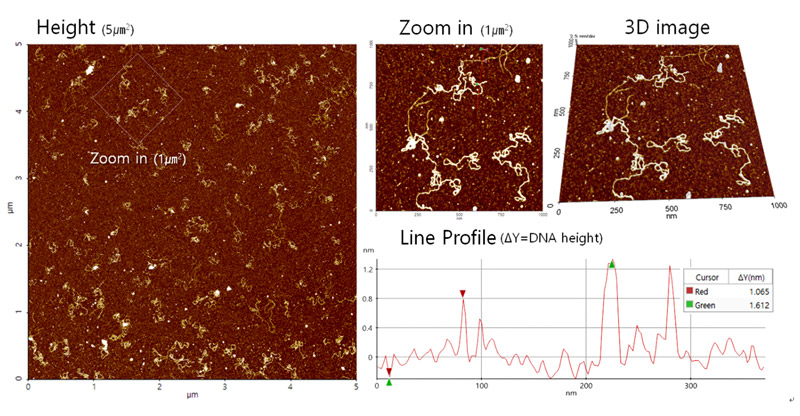
Figure 5. DNA images acquired with AC mode using a Park NX10 AFM. The instrument used a shielded liquid probe hand to scan the sample under aqueous conditions.
Reference
[1] Lynch, Michael. The Origins of Genome Architecture. Sunderland, MA: Sinauer Associates, 2007.
[2] Sergey Belikov et al., “Thermal Tune Method for AFM Oscillatory Resonant Imaging in Air and Liquid”, 2014 American Control Conference(ACC)
[3] Lyubchenko, Y.L., “Preparation of DNA and Nucleoprotein Samples for AFM Imaging,” Micron Vol 42 (2011) 196-206.
[4] Lyubchenko, Y.L. et al., “Visualization of DNA and Protein-DNA Complexes with Atomic Force Microscopy,” Methods Mo Biol. Vol 1117 (2014) 367-384
[5] Cheng, H. et al., “Polynucleotide Adsorption to Negatively Charged Surfaces in Divalent Salt Solutions,” Biophysical Journal Vol 90 (2006) 1164-1174.
[6] Ageno, M. et al., “The Alkaline Denaturation of DNA.” Biophysical Journal 9.11 (1969): 1281–1311.
[7] Good, N.E. et al., “Hydrogen Ion Buffers for Biological Research,” Biochemistry Vol 5 (1966) 467-477.