


Surface Roughness Measurement of Media and Substrate
Eunji Shin (Industrial Product Management of Park Systems, Seoul, Korea)
Atomic force microscopy (AFM) is useful for investigating the surfaces and characteristics of different materials down to nanometer detail1-6. Accurate surface roughness measurement is not only a highly powerful technique for understanding the basic physics of materials, but also very useful in examining device structures and their failure mechanisms. In addition, roughness repeatability is one of the very important factors in industrial applications as it relates to the customer’s product reliability. Park AFM’s True Non-Contact Mode is especially essential for accurate and repeatable surface roughness measurement. In order to measure accurate and repeatable roughness, two key requirements need to be satisfied. First is maintaining the tip sharpness and the other is lowering the system noise. In this paper, we examine these two requirements for measuring surface roughness. Also, we demonstrate why True Non-Contact mode is powerful for accurate roughness measurement by testing a tip-check sample and ultra flat media samples using Park AFM.
Requirements for Accurate Roughness Measurement
To measure accurate and repeatable roughness, the first thing to consider is the tip effect. That is because the tip geometry directly correlates to the roughness value. As shown in Figure 1, when the tip is sharp, it obtains an accurate feature of the surface. But as the tip becomes blunt, it cannot approach the bottom of the sample, so it obtains a skewed feature of the surface. In short, as the tip radius increases, the roughness value decreases. That is why the tip sharpness needs to be preserved during the roughness measurements.
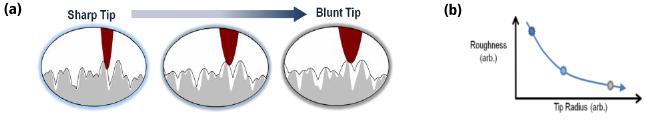 Figure 1. (a), (b) show the tip effect on roughness measurement.
The system noise is equally important. The reason is when the noise gets mixed into the AFM results, the AFM cannot accurately measure the ultra flat surface. To detect the smallest of sample features and to image the flattest of surfaces, low system noise is required. Therefore, Park Systems has engineered instruments that hold the industry’s lowest noise floor specification of < 0.5Å. As shown in Figure 2a, Park AFM systems routinely achieves about 0.2Å rms. Hence, it is good enough to measure the ultra flat sample, as shown in Figure 2b.
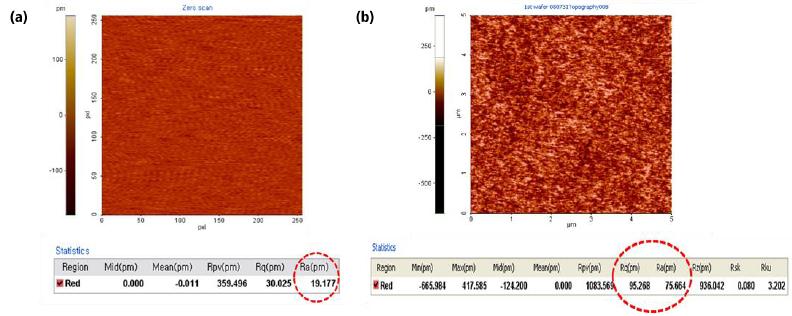 Figure 2. (a) noise floor data is determined using a “zero scan”. With the cantilever in contact with the sample surface, the system noise is measured at a single point under the following conditions: 0 x 0 nm scan, staying in one point / 0.5 gain, in contact mode / 256 x 256 pixels. (b) The roughness image of ultra flat surface was acquired with an XE-HDM in True Non-Contact mode at 1 Hz with 256 pixel resolution.
Accurate and Repeatable Surface Roughness Measurement by True Non-Contact Mode
In Figure 3, we evaluated how the tapping and the non-contact modes affect tip properties over sequential scans by imaging a tip tester sample of CrN layer (Swiss Center for Electronics and Microtechnology, Inc., SA). As shown in Figure 3a, the non-contact mode obtained consistent and sharp image quality even after the 100th scan. But in the tapping mode, the tip wore down quickly even before the 10th scan affecting the scan image quality significantly; the tip sharpness degraded more than 80% as shown in Figure 3b. On the other hand, True Non-Contact mode preserved the tip sharpness even after imaging 200 images of CrN. Whereas in the tapping mode, the tip diameter changed significantly as its tip end got damaged progressively during the scans.
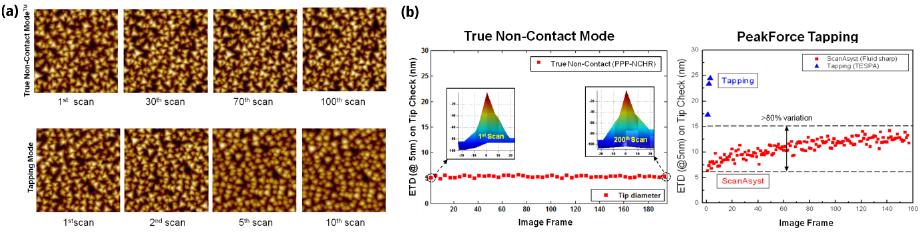 Figure 3. AFM Measurements of CrN Tip Tester Sample in different Imaging Modes. (a) True Non-Contact mode images from 100 sequential scans and the tapping mode images from 10 sequential scans. (b) The ETD(@5nm) on tip check between the True Non-Contact mode and Peak Force Tapping mode.
The data results in Figure 4 show that when tip sharpness is preserved, the accurate roughness measurement is also preserved. We took more than 700 images in non-contact mode of the same location on the sample with one tip, and monitored a long term variation in surface roughness measurement. We acquired the average roughness value of 1.498Å (Ra) with a standard deviation (σ) of 0.024Å as shown in Figure 4a. In Figure 4b, we can observe that the high resolution imaging was maintained during the 752 sequential imaging. Figure 4c shows the preserved tip profile that was obtained by VLSI CD Standard sample. The tip shape before and after all the measurements are virtually the same, which indicates there were no noticeable tip wear during the measurements.
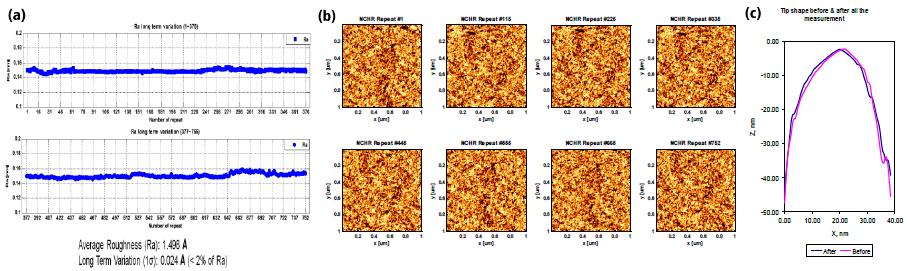 Figure 4. AFM measurements of hard disk drive media sample in Non-Contact Mode. (a) It shows the consistent and reliable data throughout 752 repeated measurements. (b) Non-Contact mode images from 752 sequential measurements. (c) The tip profile measured with VLSI CD Standard sample, both before and after 752 repeats.
Hence, we have shown the reliability of the non-contact AFM for surface roughness measurement and topographical imaging with sub-angstrom precision. In Figure 1 and 2, we have demonstrated why tip sharpness and low system noise are required for surface roughness measurement. Also, the AFM images and the ETD analysis in Figures 3 and 4 show that only True Non-Contact mode minimizes tip degradation, keeps sample free from damage, and prolongs high-resolution imaging throughout the AFM scan. Hence, it is clear that the non-contact mode AFM has unique characterization capabilities for industrial applications.
Reference
1G. Binning, C. Quate, and C. Gerber, Phys. Rev. Lett. 56, 930 (1986)
2D. R. Baselt and J. D. Baldeschwieler, Rev. Sci. Instrum. 64, 908 (1993).
3P. K. Hansma, B. Drake, D. Grigg, C. B. Prater, F. Yashar, G. Gurley, V. Eligns, S. Feinstein, and R. Lal, J. Appl. Phys. 76, 796 (1994)
4R. Barrett, Rev. Sci. Instrum. 62, 1393 (1991).
5K. Nakano, Rev. Sci. Instrum. 69, 1406 (1998).
6J. Kwon, J. Hong, Y. S. Kim, D. Y. Lee, K. Lee, S. M. Lee, and S. I. Park, Rev. Sci. Instrum. 74, 4378 (2003)