


Park SmartScan and AutoScript: Improving Operational Throughput and User Productivity
Gerald Pascual, Mina Hong, Byong Kim, and Keibock Lee
Park Systems, Inc., 3040 Olcott Street, Santa Clara, CA 95054, United States of America
Introduction
Atomic force microscopy (AFM) was originally developed in the 1980s with its first usage in published experimentation taking place in 1986. AFM operation is based on using a cantilever with a sharp probe tip, with an average radius curvature of several nanometers, to scan across a sample surface. The deflections and contortions of the cantilever as its probe tip traces the topography of the sample surface is recorded and then rendered into a computer-generated image for user analysis. Over time, AFM has seen a number of dramatic advances which have enabled it to measure other types of signals from samples not just mechanical feedback. Electrostatic and magnetic forces as well as thermal and electrical conductivity are amongst many quantities now measurable with AFM. Yet despite the advances in the versatility and accuracy of AFM over the years, breakthroughs in improving user throughput have until now historically remained modest in comparison. For example, a common hardware design in many basic AFMs consists of a small sample stage, often manually controlled, that limits the size and number of samples which can be scanned and siphons user attention during tool operation. Boosting the productivity of the AFM user is one of the core principles for AFM innovation guiding instrumentation vendors such as Park Systems. And now, one of Park's next-generation initiatives to vastly improve AFM user output is ready for mass adoption: AutoScript, a software-assisted means for even beginning AFM users to automate tool operation.
AutoScript enables AFM automation by leveraging a fundamental system design choice, a motorized sample (XY) stage, and a recent landmark advance in AFM operation software, Park SmartScan [1]. The large motorized sample stage on Park AFMs affords them several distinct advantages. First, it allows users to load much larger samples to scan than would be otherwise possible on competing systems. Second, it also allows users to simultaneously load smaller-sized samples for sequential scanning—perfect for investigating sets of samples at a time and reducing tool downtime. Lastly, as it is motorized and controlled with command inputs made in the operation software, the stage no longer has to be manually adjusted by an operator when it comes time to scan a different portion of the sample or a different sample entirely. Park SmartScan further builds upon these advantages by introducing several synergistic features of its own. In the software's Auto Mode, a self-optimizing scan parameter algorithm simplifies AFM operation for inexperienced users into a straightforward slider adjustment which trades off between scan quality versus speed. Gone now are the tedious trial-and-error approaches previous generations of AFM users had to endure to get the best results out of their scans. With Auto Mode, scan parameters to produce exemplary AFM images can be logged by the system and exported for use in future scans. This ability to generate and leverage pre-optimized scan parameters is extremely potent and serves as the catalyst which enables AutoScript to be as useful as it is for increasing user throughput.
Method
AutoScript, along with other enhanced user productivity functions, can be found in another of Park SmartScan's operating modes, Program Mode. As with other similar automation solutions, AutoScript is powered by a series of scripted sample stage movement commands (a recipe) which are interspersed with calls to conduct sample scans using a set of specific parameters (a method). To begin creating a recipe, the user activates AutoScript from within Program Mode(see Figure 1) and is given a series of blank data fields to fill in using XY coordinates that correlate to specific locations on the sample stage (see Figure 2). These XY coordinates automatically populate the data fields when the user calls up the motorized sample stage's controls from within AutoScript and manually guides the stage to a specific location, such as where a sample is currently loaded, underneath the AFM tip. After the XY coordinates for this first scan site have been entered into the recipe, a method can then be assigned in order to define how the imaging should be performed there (see Figure 3). This is particularly compelling for inexperienced AFM operators wishing to automate several scans in sequence—they can take immediate advantage of AutoScript by simply using Park SmartScan's Auto Mode to pre-generate optimized methods for them. These two simple steps of defining a recipe's scan locations and assigning a method to each of them is then repeated until all of the desired scans have been scripted. For studies that require larger data sets and more images of the same scan sites, repeating previously scripted steps is as easy as simply copying and pasting multiple row selections as many times as needed. On a Park AFM configured with precision encoders, it is possible to achieve 2 µm repeatability in the XY direction (at 1 µm resolution) and 1 µm repeatability in the Z direction (at 0.1 µm resolution) [2].
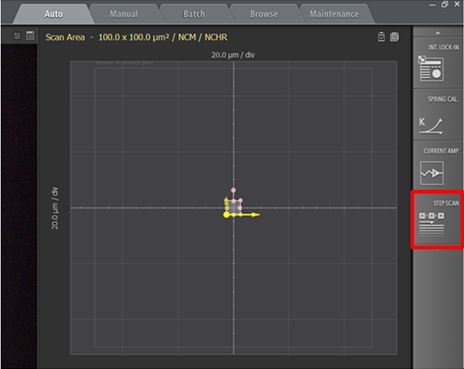 Figure 1. Screenshot of Park SmartScan emphasizing the quick accessibility to advanced functions. Inset red square focuses on the software toggle to activate AutoScript.
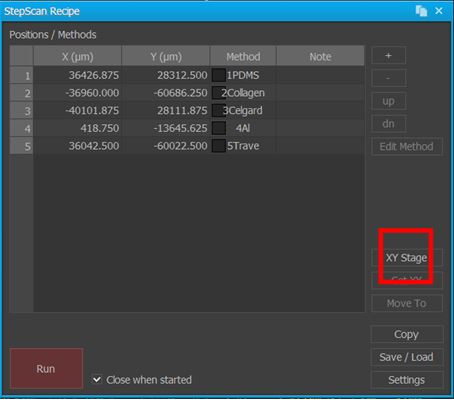 Figure 2. Screenshot of AutoScript's interface for designing a recipe of scripted AFM scans at specific coordinate-based locations on the AFM's sample stage. Note the inset red square which launches a command window for the user to manually control the stage and have the software automatically determine the coordinates for stage's current position.
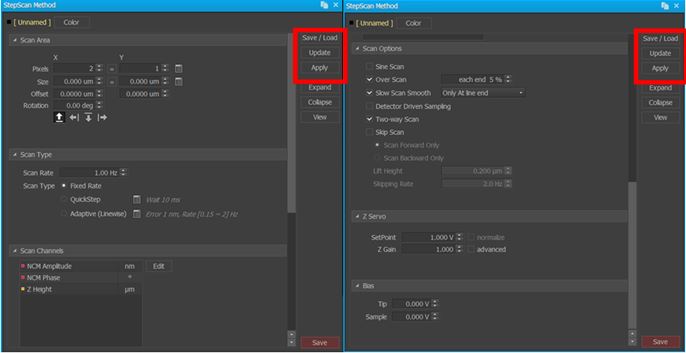 Figure 3. Screenshots of AutoScript's interface to implement user-specified methods for one of several AFM scans added to a recipe. Note the inset red square focusing on the user-toggled ability to save and, more importantly, load a previously generated method such as one acquired from initial survey scans conducted with Park SmartScan's self-optimizing Auto Mode.
Upon executing a recipe finished with AutoScript, the AFM system immediately launches into action and completes all of the user-defined actions without any further operator input. First, the motorized sample stage moves and automatically places itself under the AFM probe tip at the XY coordinates of the first scan. Then, the AFM automatically brings its Z scanner down to have the AFM probe approach the sample. Modern system architecture, such as the one in Park AFM, are both sensitive enough to avoid crashing the Z scanner head onto the sample stage yet quick enough to avoid making the tip approach feel interminable. Once it is in range of the sample, the AFM probe tip engages the sample surface at the scan site and begins scanning using the method assigned in the scripted commands. The AFM probe tip disengages from the sample once the scan at the site is completed. At this point, the Z scanner will lift back up approximately 10,000 µm.
RESULTS & DISCUSSIONS
With a basic understanding of how an AutoScript recipe is set up and executed, we now have sufficient context with which to review scans captured using this function. Five commercial products were chosen for non-contact mode AFM imaging and mounted onto sample holders for simultaneous placement on the AFM's sample stage (see Figure 4). A Park NX20 AFM [3] using a public release build of Park SmartScan featuring AutoScript was used to perform scanning operations on all samples in sequence. High-resolution non-contact mode PPP-NCHR cantilevers from NANOSENSORS [4] featuring a spring constant of 42 N/m and a resonance frequency of 330 kHz were used to image each of the following: (1) a polystyrene low density polyolefin elastomer (PS-LDPE) copolymer standard sample, (2) dehydrated collagen fibrils, (3) celgard, (4) an aluminum triangular production pattern, and (5) a static random-access memory (SRAM) device.
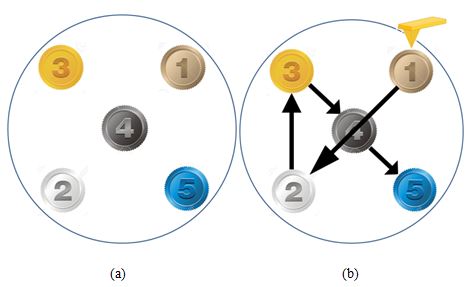 Figure 4. Diagram showing (a) the samples' distribution on the Park NX20's motorized sample stage and (b) the AutoScript-created path the stage took to bring each sample to the AFM probe tip for scanning. The five samples were (1) a PS-LDPE copolymer standard sample, (2) dehydrated collagen fibrils, (3) celgard, (4) an aluminum triangular production pattern, and (5) an SRAM device.
The five samples chosen, together as a set, demonstrate a wide variety of material properties as they range from copolymers, to proteins, to metals, to entire semiconductor devices. Despite the considerable disparity in surface roughness, stiffness values, and nanoscale structures observed in this set of samples, Park SmartScan's Auto Mode was able to successfully conduct survey scans of all samples and log optimized scan parameters for use as methods for insertion into an AutoScript recipe.
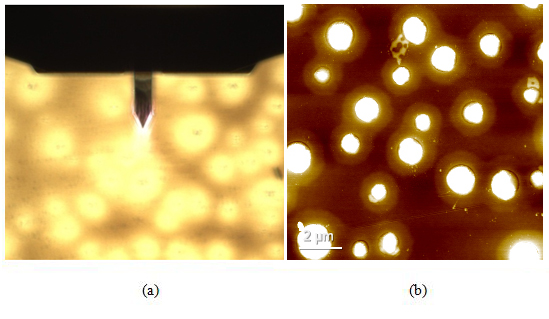
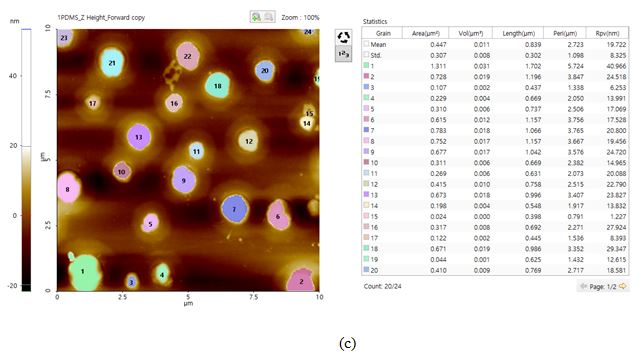 Figure 5. Optical (a) and AFM topography (b) images of the PS-LDPE copolymer standard sample as scanned using AutoScript. (c) "Grain analysis" as performed with the image processing software Park XEI based on customized criteria to determine the areas of each LDPE cluster.
Scan size: 10 × 10 µm, image size: 256 × 256 px.
Figure 5 shows the opt¬ical and AFM topography images of the PS-LDPE copolymer standard sample. This sample is a copolymer of two widely used plastics that have been blended in an attempt to offset one another's material weaknesses [5]. In the AFM image, the darker color represents the PS substrate. The LDPE portion of the sample is represented by the clusters of white scattered through the scan area. Furthermore, the boundaries of each LDPE cluster, as well as several features on top of each of them, are observable in the AFM image. Using the "Grain" function of a separate piece of image processing software, Park XEI, it was determined that the mean area of the LDPE clusters was roughly 0.447 µm2.
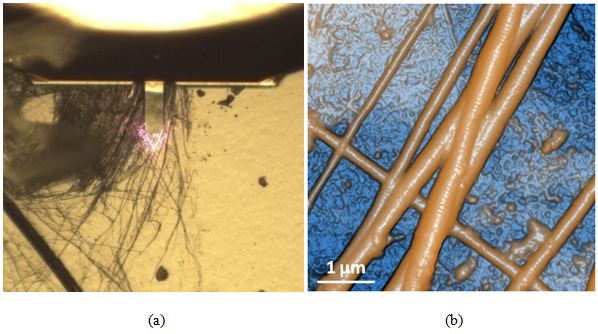 Figure 6. Optical (a) and AFM topography (b) images of the dehydrated collagen fibrils sample as scanned using AutoScript.
Scan size: 5 × 5 µm, image size: 256 × 256 px.
Figure 6 exhibits the optical (a) and AFM topography (b) images of dehydrated collagen fibrils. Collagen is an important structural protein most commonly found in the form of very long fibrils with an axial periodic structure and is abundant in animal tissues [6]. The AFM image unambiguously reveals the differences between the fibrils and the substrate on which they were mounted. Each fibril is revealed to be segmented upon closer inspection of its topography. Furthermore, the fibrils were observed to be gathered in several bundles whose diameters ranged from 60 to 600 nm depending on the number of constituent bodies.
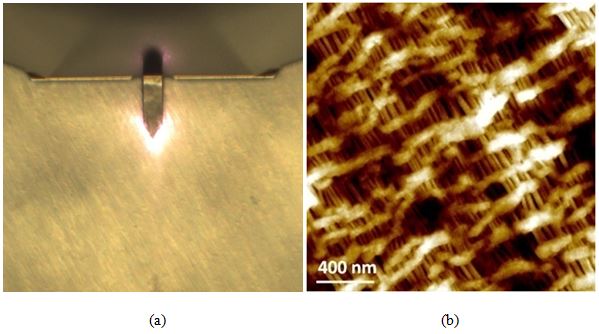
Figure 7. Optical (a) and AFM topography (b) images of the celgard sample as scanned using AutoScript.
Scan size: 2 × 2 µm, image size: 256 × 256 px.
Figure 7 consists of the optical (a) and AFM topography (b) images of the celgard sample. The AFM image provides evidence of celgard having a porous and height-varied structure as well as the presence of freely suspended fibril-like structures—both of these features would prove challenging to track with other microscopy techniques. The sample height variation detected is about 60 nm. As observed below, celgard's otherwise difficult to characterize surface topography was not a problem for non-contact AFM imaging via AutoScript.
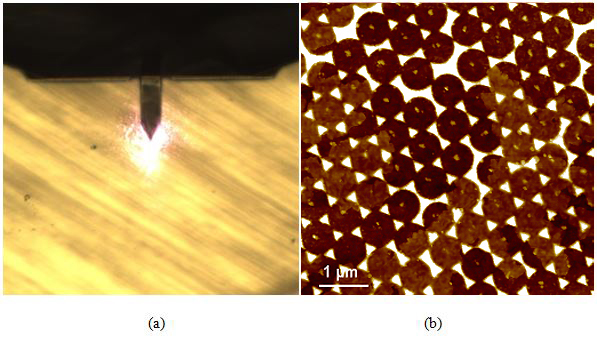
Figure 8. Optical (a) and AFM topography (b) images of the aluminum triangular production pattern sample as scanned using AutoScript. The sides of each of the completed triangles are 170 nm each in length.
Scan size: 2 × 2 µm, image size: 256 × 256 px.
Figure 8 displays the (a) optical and (b) AFM topography images of the aluminum triangular production pattern sample. This sample is noteworthy because it features sharp edges as tall as 15 nm. Fully formed triangles on the sample were found to be equilateral in geometry and featured side lengths of 170 nm. The self-optimized scan parameters obtained in the initial Auto Mode survey scan remained viable when used in a later scan on the same sample after the AFM had been scripted to image other types of samples in the interim period.
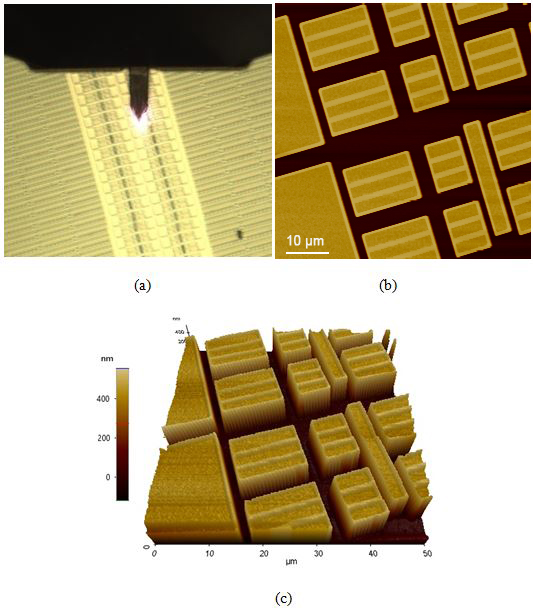
Figure 9. Optical (a), AFM topography (b), and (c) 3D AFM topography images of the SRAM device sample as scanned using AutoScript.
Scan size: 50 × 50 µm, image size: 256 × 256 px.
Figure 9 consists of the (a) optical, (b) AFM topography, and (c) 3D AFM topography images of the final sample: an SRAM device. SRAM is one of the major types of computer memory and is a common candidate for nanoscale characterization studies [7]. The height variation on this sample is even greater than that of the aluminum triangular production pattern as the device trenches were a steep 400 nm drop from the top of the device. This particular sample was imaged at a higher scan speed than the other samples in the set and is noteworthy for the AFM images' quality despite this condition.
Summary
AutoScript, along with other user productivity initiatives introduced by Park Systems, represents a sea change in how much work an AFM can accomplish. The sweeping increase in AFM throughput generated by AutoScript is not limited to veteran users already intimately familiar with how best to scan particular types of samples. Beginner AFM users, as well as those who are working with unfamiliar samples, are now just as capable as more experienced colleagues of acquiring the highest resolution and most accurate images from multiple (and even completely dissimilar) samples en masse. Opening up the power of AFM to a wider audience, democratizing the technology by making its more compelling features more accessible than ever before, is one of the key motivations that drove the development of the AutoScript function and the rest of Park SmartScan operation software. The proliferation of nanoscale characterization via AFM and the corresponding increase in the volume and quality of nanoscience research are now merely matters of time and adoption.
REFERENCES
[1] Park SmartScan – Park Systems. Retrieved October 07, 2016, from http://www.parkafm.com/index.php/products/operating-software/park-smartscan
[2] Park NX20 AFM Options – Park Systems. Retrieved October 07, 2016, from
http://www.parkafm.com/index.php/products/large-sample-afm/park-nx20/specifications
[3] Park NX20 – Park Systems. Retrieved October 07, 2016, from
http://www.parkafm.com/index.php/products/large-sample-afm/park-nx20/
[4] PPP-NCHR – NANOSENSORS. Retrieved October 07, 2016, from
http://www.nanosensors.com/PointProbe-Plus-Non-Contact-Tapping-Mode-High-Resonance-Frequency-Reflex-Coating-afm-tip-PPP-NCHR
[5] Ryu, J.G., Kim, H., Kim, M.H., and Lee, J.W., Morphology and mechanical properties of LDPE/PS blends prepared by ultrasound-assisted melt mixing, Korea-Australia Rheology Journal, September 2004, vol. 16, no. 3, pp. 147-152.
[6] Kadler, K.E., Holmes, D.F., Trotter, J.A., and Chapman, J.A., Collagen fibril formation, Journal of Biochemistry, May 1996, vol. 316, pp. 1-11.
[7] Pineda, J.P., Pascual, G., Kim, B., and Lee, K., Electrical Characterization of Semiconductor Device Using SCM and KPFM Imaging, NanoScientific, 2016, Fall, pp.14-16.