


Cell Biology
Park PinPoint™ Mode For Cell Biology

By Brian Choi, Bio-application Scientist at Park Systems
PinPoint Mode Enables Surface Nanomechanical Property Imaging
In addition to nano-scale three dimensional imaging, nano-mechanical property measurement is one the most popular functions of atomic force microscopy (AFM). The basic AFM mode for nano-mechanical property measurement is force-distance (FD) spectroscopy.
FD spectroscopy measures the physical properties of the sample surface, such as its hardness, adhesion, etc. by using nano-size cantilever tip to push the sample in the range of nN-scale.
Nano-mechanical property characterization at the nN-scale is possible only with the AFM therefore it is widely used in material science, physics, chemistry, etc. for various nano level research. FD spectroscopy is also popular in biological research because it is the only technique available which can physically measure the single molecular binding force. Recently, new application of FD spectroscopy is being developed which is the study of comparing physical properties of a single cell or a tissue with various functions or diseases to make a diagnosis.
In order to analyze the physical properties of a single cell in accordance with the biological functions, FD spectroscopy should be aligned exactly with the topographical data. In general, the topography of a sample is acquired first and FD spectroscopy is performed on the specific position using topographical data as a reference map.
AC AFM mode (dynamic or tapping mode) is generally used to minimize the AFM artifact from sample-tip interaction in biological sample imaging. However, it is very difficult to avoid the positional errors correlating topographical data and FD spectroscopy data because the soft and sticky nature of the biological samples introduce unavoidable various AFM artifacts even during AC mode. The PinPoint mode was newly developed to compensate the positional errors between topographical and FD data.
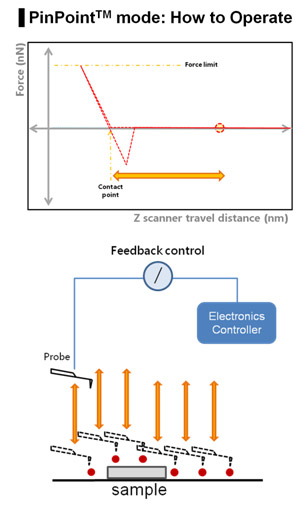
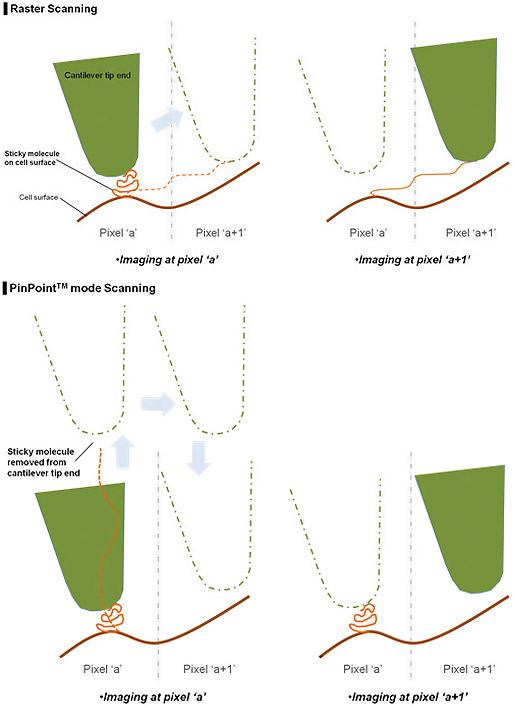
The PinPoint mode does this by its capability to simultaneously acquire topographical data and the FD data at each pixel, as shown in Fig 1. There is a significant difference from the conventional AFM imaging of the raster scan with Z scanner feedback. In the PinPoint mode operation, the cantilever approaches at each pixel in the entire scan area (for example 256x256 pixel = 65536 points) to acquire the height of the sample surface to generate 3D topographical image of the sample and FD spectroscopy information at the same time.
By lifting the cantilever tip perpendicularly from the sample surface at every pixel, it provides extra clearance space when the cantilever tip moves to the next pixel position during the PinPoint mode as shown in Fig. 2. Even if there is an adhesive interaction between the sample surface and the cantilever tip at the previous point (Pixel a) that connection is completely removed before arrival at the next pixel point (Pixel a+1), hence an accurate topographical information is obtained and the tip-sample interaction information at each pixel can be saved.
This is the biggest advantage of the PinPoint mode, in that simultaneous acquisition of height and FD data guarantees the accuracy of correlating between two types of information. PinPoint mode operation can be controlled by users using preset parameters shown on the left column of Fig. 3.
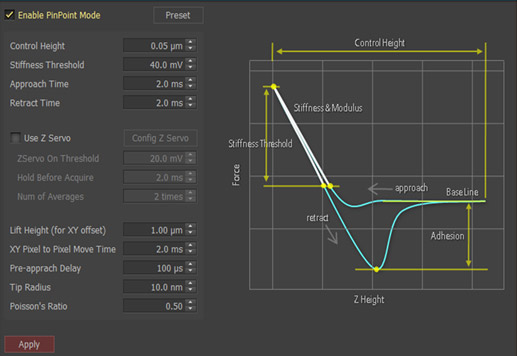
The preset parameters include such as the control height, the stiffness threshold for topographical and FD data, the approach and retract time, the lift height, the XY pixel to pixel move time, and the pre-approach delay for determining a scanning speed, etc. The important preset parameters to be determined carefully are the stiffness threshold and the control height.
The AFM cantilever presses on the sample surface repeatedly with certain amount of force determined by the stiffness threshold. In order to obtain accurate FD spectroscopy data, the stiffness threshold should be determined carefully.
The control height determines the retraction height during movement between pixels after cantilever pushes away from the sample surface. The control height is the most delicate parameter to control because it greatly depends on the type of sample surface characteristic. Generally speaking, smaller number can be used for smaller step height and bigger number for bigger step height. However, in the case of a sample with sticky surface the control height should be appropriately increased in order to clearly disconnect the tip-sample interaction before moving to the next pixel, even if the step height is small.
The three physical properties which can beobtained simultaneously through PinPointmode are the surface morphology, elasticitymap, and adhesion force map.
a. Surface Morphology (Height)
The height information constituting the morphology of the sample surface is determined when the designated stiffness threshold is reached. In other words, the Z detector records how much Z scanner is extended when the certain cantilever deflection, determined by preset stiffness threshold, is reached. The level of cantilever deflection can be accurately designated in the NXP software from Park Systems for optimized surface morphology.
b. Elasticity (Stiffness)
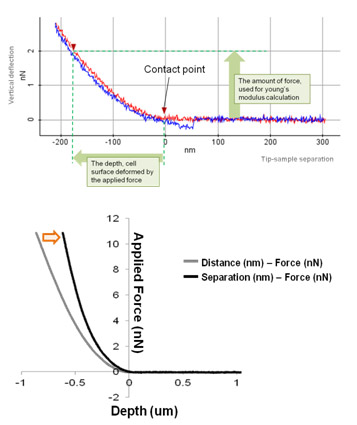
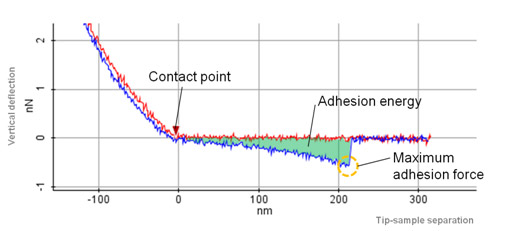
The elasticity (stiffness) at the certain position of sample surface can be obtained by the same way in the FD spectroscopy. The stiffness can be obtained from the slope of FD curve from contact point to deflection threshold generated during the PinPoint mode operation. Applying Hertz model, designed for soft and elastic samples, user can calculate elasticity (Young's modulus) from the slop, too. In order to calculate Young's modulus using Hertz model equation, FD curve should be converted to tip-sample separation curve to determine the deformation depth from the sample surface. (Fig. 4) For the accurate measurement of the Young's modulus, the accurate positioning to determine the contact point with cantilever tip is very important. The data processing algorithm of NXP automatically generate a Young's modulus image map from the PinPoint mode operation.
c. Adhesion
In addition to the elasticity map, the adhesion map also can be generated by using PinPoint mode imaging. The adhesion image is generated based on the maximum adhesion force value. The total adhesion energy at each pixel also can be obtained by measuring green area in Fig. 5.
Application
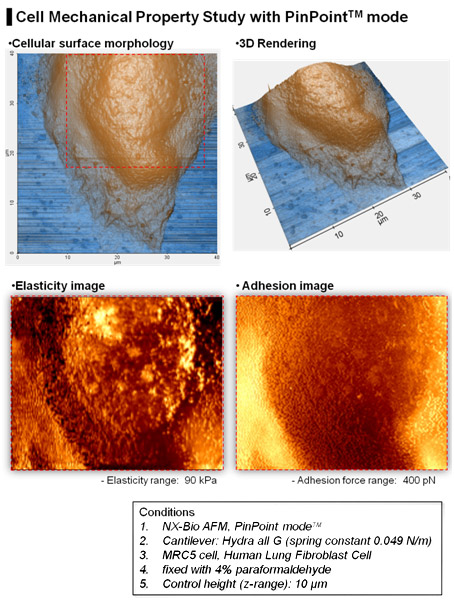
As shown in Fig. 6, the elasticity and the adhesion map of a single MRC5 cell was obtained one 3D topographical image at the same time on the NX-Bio using PinPoint mode. The coloring of each pixel representing the elasticity and the adhesion map was determined from the calculation generated by PinPoint FD curve at each pixel. 3D topography shows exact positional match with the FD spectroscopy maps. The higher elastic property can be noted on the nucleus compared to its surrounding areas. The absence of AFM artifacts, such as scratch or streak marks which can be seen frequently in imaging a cell or biological samples in liquid, is an additional benefit of PinPoint mode.
Live Cell Volume Measurement of SICM
Cell Volume Measurement of Scanning Ion Conductance Microscopy
Myunghoon Choi (Research Product Management of Park Systems, Seoul, Korea)
Ion conductance microscopy (SICM)1 is a useful tool for obtaining non-invasive images of cell surface topography. Recently, it has been used for imaging live cells in culture medium2. Cell volume is one of the important factors for cell research because the regulation of cell volume is fundamental to cellular homeostatic mechanism3. SICM can provide accurate volume measurement of cells due to its ability to acquire quantitative dimension information. Furthermore, it can calculate cell volume changes over time caused by physiological environment or its cell status changes. In this paper, live HEK293T cell was successfully imaged and its volume changes monitored using Park SICM.
Human embryonic kidney(HEK) 293T cell was cultured on glass-coverslip in DMEM(dulbeco’s modified eagle medium) with 10% FBS(fetal bovine serum) containing 1% penicillin at 37°C in a 5 % CO2 humidified atmosphere (Multi Gas Cell Incubator, SANYO, JAPAN). Then, the grown cell coverslip was transferred to the Live Cell Chamber installed in the Park XE-Bio (Park Systems). While the cell was being cultured in the live cell chamber (37°C, 5% CO2, and >70% humidity), a live cell’s images were acquired by SICM-ARS mode4. The pipette used for the SICM was pulled from borosilicate glass (O.D.,1.0 mm, I.D., 0.58 mm, length 90 mm;Warner Instruments, US) using a CO2-laser-based micropipette puller (P-2000,Sutter Instruments, Novato, US). The inner and outer diameters of the pipette were about 100 nm and 200 nm, respectively.
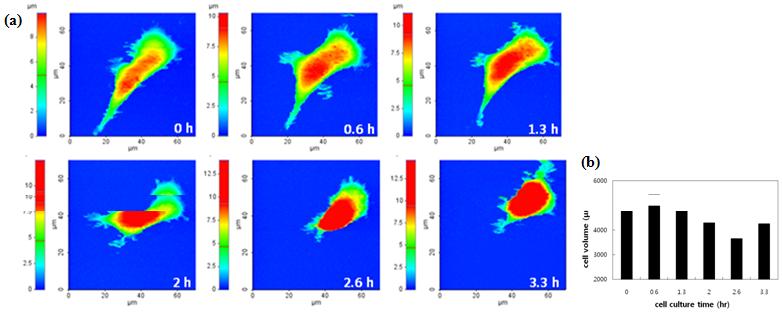
Figure 1 (a) Sequential HEK 293T live cell images. It took approx. 0.6 hour to obtain each image, and a total of 3.3 hours for 6 images. (b) Volume change of HEK 293T: the initial cell volume was 5008 μm3; 2.6 hours later it shrank to 3645 μm3.
Cell Volume Analysis Method
Using Park XEI image processing software, the cell volume was calculated from the SICMimage data. After the cell area had been selected, the volume of the chosen area was calculated automatically.
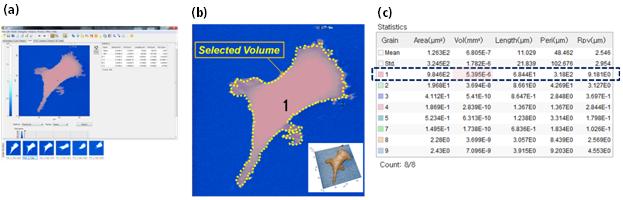
Figure 2 Illustration of the process for the cell volume measurement.
(a) Park SICM image of HEK cell (0.6h) loaded at main frame of Park XEI software.
(b) Cell area selected as pink, marked as ‘1’.
(c) The volume of selected cell area (pink, 1) calculated as 5395 μm3.
Figure 1 is an example that explains how well SICMmeasures cell’s morphology in detail. The SICM images show the whole cell shape clearly including its delicate structures. It even shows the filopodia (the small projections around the cell) distinctively–something that is difficult to be distinguished using optical microscopes. In addition, the quantitative dimension information from the SICM allows the calculation of the cell volume precisely as shown in Figure 2. The cell volume measurement method by SICM gives more quantitative and accurate results compared to the method that monitors reagent like ions or fluorescence dyes with quantitative fluorescence microscopy5 or ion-sensitive microelectrodes6.
Hence, the SICM method gives useful information to cell researches related with hypertrophy. For instance, the quantitative volume measurement provides a new method to analyze and gauge the changes in the cell structure of cardiomyocyte that are frequently accompaniedby the changes in its volume7.
Reference
1P. K. Hansma, B. Drake, O. Marti, S. A. Gould, C. B. Prater, Science 243, 641 (1989).
2Y. E. Korchev, C. L. Bashford, M. Milovanovic, I. Vodyanoy, M. J. Lab, Biophys. J. 73, 653 (1997).
3M. Miragoli, A. Moshkov, P. Novak, A. Shevchuk, V.O. , et al., J. R. Soc. Interface doi:10.1098 (2010).
4C. Myunghoon, K. Ahram, XE-Bio Application Note 1., Park Systems (2012)
5Crowe, W.E., Altamirano, J., Huerto, L.&Alvarez-Leefmans, F.J., Neuroscience 69, 283-296 (1995)
6Alvarez-Leefmans, F.J., Gamino, S.M. & Reuss, L. J. Physiol. 458, 603-619 (1992)
7Dhalla, N.S., Saini-Chohan, H.K., Rodriguez-Leyva, D., Elimban, V.k Dent, M.R. & Tappia, P.S. Cardiovasc. Res. 81, 429-438 (2009)
Embryonic Stem Cell
Elastic Properties – F-d Spectroscopy
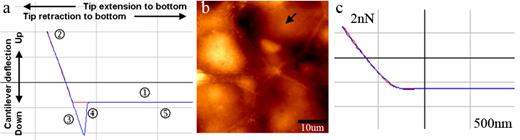
Fig 1a. AFM force-distance (F-d) curve on cover glass in air. The AFM was equipped with a super luminescence diode (SLD) and a cantilever with a spring constant of 0.06 K (N/m). The red line indicates the tip extension towards the sample (①②) and blue line indicates the tip retraction away from the sample (③④⑤). Downward cantilever deflection of the blue line indicates the adhesion force between the tip and sample (③④). b. Contact mode image of fixed human embryonic stem (hES) cells (45x45um). The arrow indicates the point where F-d curve (c) was obtained. c. The F-d curve of the hES cell. The attraction due to the meniscus force, shown in Fig 1a, is eliminated by performing the measurement in liquid. The gradual slope of the curve in the constant compliance region is related to the elastic properties of the cell.
The mechanical properties of biological systems play a major role in cellular processes. By recording and analyzing the F-d spectroscopy measurements by AFM, the elastic properties of biological systems can be determined quantitatively and reproducibly. Figs. 1a and c demonstrate the differences in force curves on stiff and soft samples. The deflection rises slower due to the deformation of the soft sample, which causes the gradual increase in the slope of the curve. Mechanical properties of many different cell types including glial cells, platelets, cardiocytes, macrophages, endothelial cells, epithelial cells, fibroblasts, bladder cells and more have been determined using F-d spectroscopy.
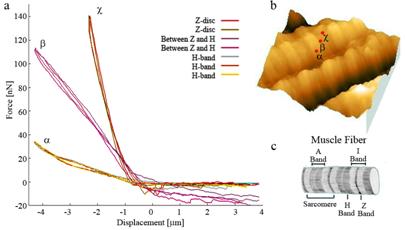
Fig 2a. F-d curve of the H-band (a), the structure between the Z and H bands (b) and the Z-band (c). The differences in the slopes of curves indicate the different elastic properties of the structures. b. Red dots (a,b,c) indicate the positions where F-d curves were taken. c. The structure of muscle fiber. (Image courtesy of Prof. N. Rozlosnik, DTU Nanotech, Denmark)
Relevant Publications Using the XE-AFM
- Noemi Rozlosnik, 2006 Nanomechanics of Single Muscle Fibers by AFM, International Nano-Conference(ICN+T), Basel(CH)
- Mette Christensen, et al., 2009 Injection of marinade with actinidin increases tenderness of porcine M. biceps femoris and affects myofibrils and connective tissue, J. of the Science of Food and Agriculture, Vol. 89:1607-14
- Manfred Radmacher, 2002 Measuring the Elastic Properties of Living Cells by the Atomic Force Microscope. Methods in Cell Biology Vol. 68:67-90
SICM Image of Suspended Collagen Fibrils
SICM Image of Suspended Collagen Fibrils
Tatsuo Ushiki and Masato Nakajima (Niigata University, Japan)
 Ion conductance microscopy (SICM) is useful for obtaining contact-free images of the surface topography and has been used for imaging cultured cells under liquid conditions. The Approach-Retract-Scan (ARS) mode is a new mode of SICM, which is especially powerful for imaging samples with steep slopes. To examine the applicability of the ARS mode for imaging biological samples with greater height gaps, dense collagen fibril networks were examined by SICM.
Sample preparation
Collagen fibrils were obtained from the tail tendon of adult Wistar rats and stored in physiological saline with 1-10 % tymol (2-isopropyl-5-methylphenol) at 4 °C for a minimum of 1 day. A small piece of the tendon was then stretched on the surface and air dried overnight, followed by immersion of the sample in physiological saline. SSICM imaging was made in the ARS mode using XE-Bio System
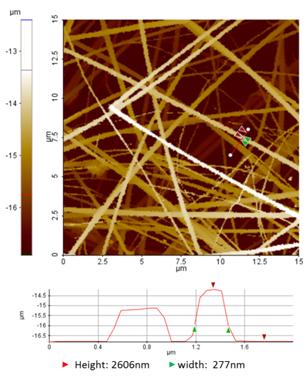
Figure 1 Dense collagen fibril networks imaged by the ARS/hopping SICM mode SICM. Line profile analysis is based on the red line indicated in the SICM image.Conclusion
Figure 1 is an example of SICM imaging of collagen fibril networks using the ARS mode. The width of the individual fibrils varied from 50 to 470 nm. The section profile also showed that the width of the collagen fibril indicated by green arrows was 277 nm and the height difference between the glass surface and the fibril was 2606 nm. This result indicates that some fibrils are suspended over the glass substrate during scanning for SICM imaging. Thus, the ARS mode of SICM has the advantage of minimizing (or free from) the loading force, which is unavoidable in AFM.
Reference
1P. K. Hansma, B. Drake, O. Marti, S. A. Gould, C. B. Prater, Science 243, 641 (1989).
2Y. E. Korchev, C. L. Bashford, M. Milovanovic, I. Vodyanoy, M. J. Lab, Biophys. J. 73, 653 (1997).
3P. Novak, C. Li, A. I. Shevchuk, R. Stepanyan, M. Caldwell, S. Hughes, T. G. Smart,, et al.. Nat. Methods 6, 279 (2009).
4T. Ushiki, M. Nakajima, M. Choi, S.-J. Cho, F. Iwata. Micron (2012, in press)
Mouse Sperm Cells
Excellent to Assess the Morphological Features of Sperm Cells
Sperm morphology is assessed routinely as part of standard laboratory analysis in the diagnosis of human male infertility. It is well-known that the morphology of fertile sperm is significantly different from that of infertile sperm.
Optical microscopy has been used to observe the morphological features of sperm cells, but requires sample staining and offers only limited resolution.
In contrast, atomic force microscopy doesn’t need any sample staining. Furthermore, it provides much higher resolution images than optical microscopy.
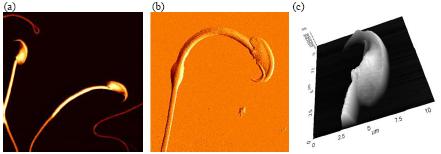
Figure 1. High resolution AFM Images of mouse sperm cells. (a) Topography of sperms (45 μm scan size), (b) error image of sperm (25 μm scan size) and (c) 3D rendering of topography image of sperm head (11 μm scan size).
Figure 1 and 2 show high resolution AFM images of mouse sperm cells. Mouse sperm cells were extracted from the mouse testis tissue and fixed with 1% glutaraldehyde and 1% paraformaldehyde in phosphate buffered saline. Then, they were attached onto the poly-L-lysine coated glass slide and it was washed out with filtered distilled water twice.
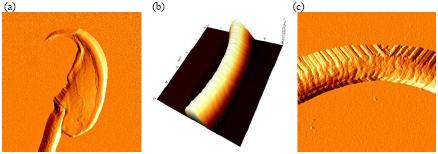
Figure 2. High resolution AFM images of mouse sperm cells. (a) Error image of sperm head (11 μm scan size), (b) 3D rendering of topography image of sperm tail (5 μm scan size) and (c) error image of sperm tail (5 μm scan size).
The images were obtained using contact mode AFM in air. A gold-coated silicon nitride cantilever was used to image the sample. Its spring constant is approximately 0.06 N/m.
AFM images can be quantitatively analyzed using XEI software. The dimensions and features of sperm cell parts can be measured and evaluated with the strict criteria for sperm morphology.
The Park AFM is expected to become an excellent tool to assess the morphological features of sperm cells.