


Atomic Force Microscopy – Scanning Electrochemical Microscopy (AFM-SECM): measurements in a glovebox
Sven Daboss1, Christine Kranz1
1Institute of Analytical and Bioanalytical Chemistry, Ulm University, D-89081 Ulm, Germany
Introduction
Correlating electrochemical with morphological and nanomechanical information to obtain local structure-activity information is crucial in many energy-related topics dealing with heterogeneous samples. Combining scanning probe microscopy techniques [1–4] like hybrid AFM-SECM [5] gives access to high-resolution information on interfacial processes, such as spatially resolved electrochemical information, nanomechanical properties (e.g., adhesion properties, Young’s modulus), aging processes or interphase formation. Especially, this hybrid technique has various applications in battery research, providing valuable insights into the electrochemical behaviour and performance of battery materials and devices. By combining high-resolution imaging with localized electrochemical measurements, this technique contributes to the development of advanced batteries with improved efficiency, stability, and lifespan [1]. Figure 1 displays Park Systems’ NX10 in combination with a bipotentiostat and a preamplifier located inside the glovebox. Using modified AFM probes with an integrated electrode in combination with an adapted electrochemical cell, AFM-SECM experiments can measure in organic solution (see cyclic voltammograms as shown in Figure 2) along with PinPointTM nanomechanical measurements (Figure 3).
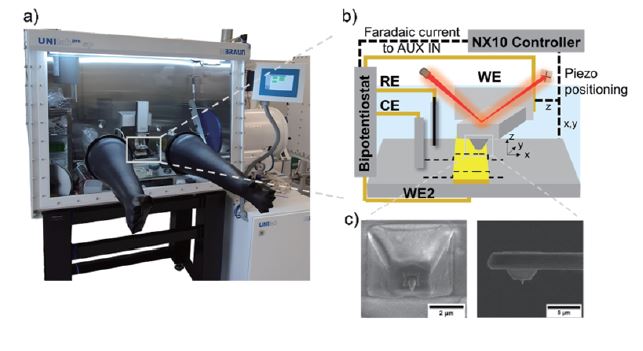
Figure 1. Setup (a, photo of the NX10 inside a glovebox) and scheme of the AFM-SECM measurement setup using a bipotentiostat (b) and customized AFM-SECM probes (c).
Experimental
The Park NX10 is housed in a glovebox (Unilab, MBraun). Electrochemical experiments are controlled via a bipotentiostat (CHI760E, CH Instruments) in combination with a preamplifier (CHI200B Picoamp Booster, CH Instruments). Several feed-throughs of the glovebox are used to connect the system with hardware located outside the glovebox (e.g., bipotentiostat). To minimize noise issues during measurements, the preamplifier is placed inside the glovebox in close proximity to the customized electrochemical cell. Additionally, the system is equipped with a Faraday cage for reliable current measurements down to a few picoamperes. The output signals from the bipotentiostat (e.g., faradaic current) are fed into the Park NX10 controller via an analog-to-digital auxiliary input conversion channel, and displayed by the scanning software (SmartScanTM, Park Systems). Measurements are performed in a three-electrode setup, with the AFM-SECM probe as the working electrode, a Pt wire as the counter electrode, and an Ag/AgCl reference electrode in either an aqueous solution of 5 mM 1,1’ ferrocenedimethanol (Fc(MeOH)2) / 0.1 M KCl or an organic solution of 5 mM ferrocene (Fc) and 0.1 M tetrabutylammonium hexafluorophosphate (TBA(PF6)) in acetonitrile or 20 mM Fc in 1 M NaClO4 in propylene carbonate (PC).
AFM-SECM measurements were recorded using self-customized probes (thorn-shaped non-conductive AFM tip: 600 - 800 nm long) with tip-integrated frame electrodes (electrodes with a length of 600 – 900 nm and a thickness of 100 nm), as shown in Figure 1 inset. These probes have spring constants in the range of ~ 0.8 N·m-1 (for details see reference). After mounting on custom-made chip carriers made from polyether ether ketone (PEEK), the electrical contact was sealed with resins like Torr Seal (Agilent) for measurements in solutions like organic solvents.Force-distance (FD) curves with electrochemical properties were recorded with AFM-SECM probes; after probe calibration, force constants were determined using the thermal noise method [7] at a slow sweep rate of 1.0 μm·s-1 to minimize hydrodynamic effects with a loading force of 30 nN and the probe biased at 0.3 V vs. Ag/AgCl (chronoamperometry) to oxidize ferrocene (redox mediator).
Results
Adjustments have been made regarding a redesign of chip carriers, probehand, and the electrochemical cell to allow measurements in organic solvents e.g., in battery electrolytes. The AFM-SECM probes were tested for their operational stability using cyclic voltammetry e.g., in organic solvent (e.g., acetonitrile) as shown in Figure 2.
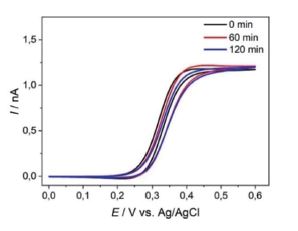
Figure 2. Cyclic voltammograms recorded at an AFM-SECM probe in 5 mM Fc(MeOH)2 / 0.1 M TBAPF6 in acetonitrile, sweep rate of 0.1 V·s-1. First cycle (black), after 60 min (red), and after 120 min (blue), sweep rate of 0.1 V·s-1.
AFM-SECM images were obtained in contact mode AFM and feedback mode SECM. Figure 3 shows AFM-SECM images (topography, deflection, and faradaic current image) recorded at a model sample consisting of a gold band electrode deposited on silicon. The size and shape of the gold band electrode visible in the topography image are in good agreement with the current response.
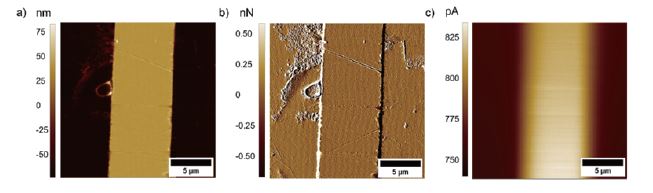
Figure 3. a) Topography, b) deflection, and c) faradaic current image of a patterned Au/Si substrate. The images were recorded with a tip-integrated AFM-SECM probe biased at 0.3 V vs. Ag/AgCl in 5 mM Fc(MeOH)2 / 0.1 M KCl solution and a scan speed of 0.4 Hz.
In addition, it can be clearly seen that the smaller features apparent in the topography and deflection image (Figures 3a and b), which apparently are not conductive, are not visible in the SECM image. Figure 4 shows exemplary line scans of the overlaid topography and SECM current extracted from Figure 3, which shows the broadened SECM response due to diffusion of the redox mediator determining the SECM feedback signal.
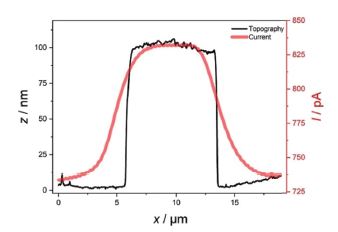
Figure 4. Exemplary line scans of topography (black) and current (red) with the AFM-SECM probe biased at 0.3 V vs. Ag/AgCl in 5 mM Fc(MeOH)2.
The same sample was also investigated using PinPoint mode in combination with SECM measurements as shown in Figure 5. At each pixel, the cantilever performs a full FD curve (shown schematically in Figure 5a), which is analysed using a suitable model like DMT or Hertz model and visualized in real-time providing nanomechanical information such as adhesion properties or stiffness. Selected line scans and images are shown in Figures 5b and c, respectively. As expected, increased faradaic current was observed at the gold pattern due to regeneration of the redox mediator (feedback mode SECM), while at the same position, reduced adhesion forces were detected, which may be attributed to the different hydrophilicity of silicon compared to gold.
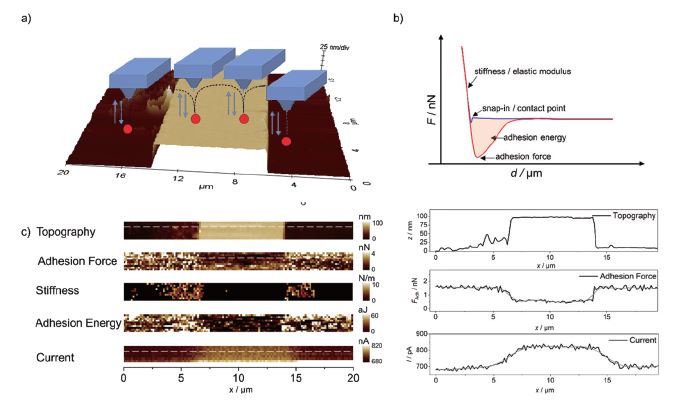
Figure 5. AFM-SECM measurements using PinPoint mode. a) 3D plot of the topography measured in contact mode in solution, along with a schematic of the PinPoint mode. b) An exemplary FD curve with the information that can be retrieved. c) Nanomechanical maps and SECM image are displayed along with extracted line profiles. v = 10 μm·s-1, E = 0.3 V vs. Ag/AgCl in 5 mM Fc(MeOH)2 / 0.1 M KCl
Future research using PinPoint AFM-SECM experiments will focus, e.g., on carbon-based composite electrodes for sodium-ion batteries, investigating the formation of interphases during charging and discharging as exemplary shown in Figure 6 for an embedded hard carbon composite anode. [8] Such measurements require that experiments are conducted in the glovebox.
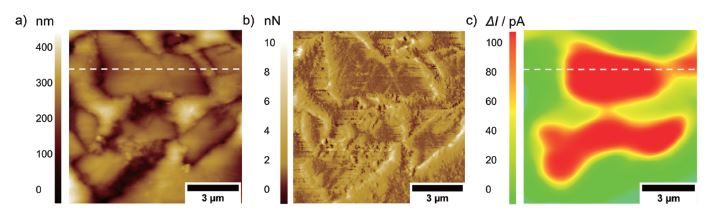
Figure 6. a) Topography, b) deflection, and c) faradaic current image on an embedded hard carbon composite electrode. The images were recorded with a tip-integrated AFM-SECM probe biased at 0.6 V vs. Ag/AgCl in 20 mM Fc / 1 M NaClO4 in PC and a scan speed of 0.4 Hz.
The positive SECM feedback current signal is clearly visible on the conductive hard carbon particles (dotted line). The insulating nature of the embedding resin results in negative feedback current, as the redox mediator cannot be re-reduced at the insulating material.
Conclusions
In conclusion, this application note presents the application of AFM-SECM techniques for investigating AFM probe local structure-activity relationships in heterogeneous samples. The experimental setup described in this study involves the use of Park Systems' NX10 AFM integrated with a bipotentiostat and a preamplifier, all housed inside a glovebox. The AFM-SECM experiments are performed using self-customized AFM probes with integrated electrodes and an adapted electrochemical cell. The system is equipped with a Faraday cage to ensure reliable current measurements, and measurements are conducted in a three-electrode setup with appropriate reference and counter electrodes. The results obtained from the experiments demonstrate the effectiveness of the AFM-SECM technique. Cyclic voltammetry experiments in organic solvents validate the stability and functionality of the AFM-SECM probes. AFM-SECM imaging in contact mode AFM and feedback mode SECM provides high-resolution topography, deflection, and faradaic current images of a model sample, allowing for the correlation of morphological and electrochemical information. PinPoint mode in combination with SECM measurements enables real-time visualization of nanomechanical properties, such as adhesion properties and stiffness, providing additional insights into the sample's characteristics. The integration of AFM-SECM techniques provides a powerful approach for obtaining detailed local structure-activity information in energy-related studies. The combination of electrochemical, morphological, and nanomechanical measurements offers a comprehensive understanding of interfacial processes, contributing to the advancement of energy materials research and development.
Acknowledgment
This work contributes to the research performed at CELEST (Center for Electrochemical Energy Storage Ulm-Karlsruhe) and was funded by the German Research Foundation (DFG) under Project ID 390874152 (POLiS Cluster of Excellence).
References
[1] S. Daboss, F. Rahmanian, H. S. Stein, C. Kranz, Electrochem. Sci. Adv. 2022, 2, e2100122.
[2] A. N. Patel, C. Kranz, Annu. Rev. Anal. Chem. 2018, 11, 329–350.
[3] A. Page, D. Perry, P. R. Unwin, Proc. R. Soc. A Math. Phys. Eng. Sci. 2017, 473, 20160889.
[4] Y. Takahashi, A. I. Shevchuk, P. Novak, Y. Zhang, N. Ebejer, J. V. Macpherson, P. R. Unwin, A. J. Pollard, D. Roy, C. A. Clifford, H. Shiku, T. Matsue, D. Klenerman, Y. E. Korchev, Angew. Chemie Int. Ed. 2011, 50, 9638–9642.
[5] C. Kranz, C. Demaille, in Scanning Electrochem. Microsc. (Eds.: A.J. Bard, M. V. Mirkin), CRC Press, Boca Raton, 2022, 513–580.
[6] C. Kranz, G. Friedbacher, B. Mizaikoff, A. Lugstein, J. Smoliner, E. Bertagnolli, Anal. Chem. 2001, 73, 2491–2500.
[7] J. L. Hutter, J. Bechhoefer, Rev. Sci. Instrum. 1993, 64, 1868–1873.
[8] S. Daboss, T. Philipp, K. Palanisamy, J. Flowers, H. S. Stein, C. Kranz, Electrochim. Acta. 2023, 453, 142345.