


Atomic force microscopy (AFM)-based Nanoindentation quantitatively characterizes local mechanical properties of target specimen. In this technique, a hard AFM indentation tip with known mechanical properties presses against a sample surface until the tip deforms the surface. The relationship between applied force and the sample deformation contains information on the local mechanical properties of the sample including hardness and Young’s modulus. AFM Nanoindentation offers precise control of the sample deformation in the nanometer range facilitated by accurate force control and can be applied on a wide range of materials including thin film coatings, metals, polymers, and biomaterials.
The hardness evaluation via AFM
Nanoindentation includes multiple tip approach and retract cycles with different force setpoints to permanently deform the sample surface. These permanent sample indentations, formed during the Nanoindentation experiment at different forces, are subsequently imaged via Park’s True Non-contact mode to measure the residual indentation area AI. The sample hardness H is then calculated from AI and the applied force FI as:
H= FI /AI
Commonly, AFM Nanoindentation uses a three-sided pyramidal tip (Berkovich tip) attached to an AFM cantilever. Figure 1 (a) shows the surface topography of a single crystal natural diamond indentation tip obtained via Park Systems' True Non-contact mode. It should be noted that while sharp silicon tips improve the spatial resolution in AFM imaging, repeated Nanoindentation measurements can lead to tip wear, which complicates the tip characterization and data analysis. Therefore, we recommend the use of diamond AFM indentation tips over conventional silicon sharp tips, since the well-defined tip geometry and minimal tip wear of diamond tips allow higher repeatability and more accurate quantitative mechanical properties measurement.
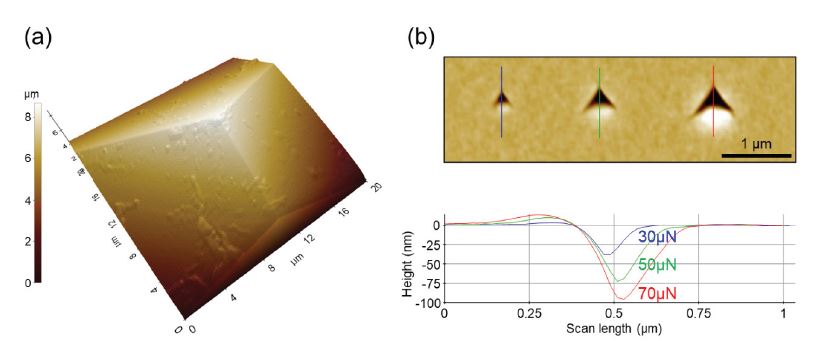
Figure 1. (a) AFM topography of an AFM indentation tip, and (b) height image obtained via True Non-contact mode on a SiOCH sample surface after performing Nanoindentation experiments with three different force setpoints using the AFM indentation tip of (a). Line profiles show the increase of the indentation areas with higher forces.
Figure 1 (b) shows an AFM height image measured with Park Systems' True Non-contact mode on a carbon-doped hydrogenated silicon oxide (SiOCH) film after Nanoindentation experiments using an AFM indentation tip with different forces (30 μN, 50 μN, and 70 μN). The cross-sectional height profiles of each indentation display the increasing indentation depth as well as residual indentation area with higher forces. The residual indentation area can be quantitatively measured using Park’s data analysis software, as shown in figure 2.
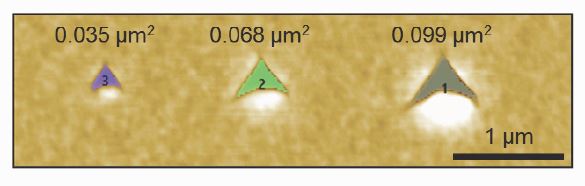
Figure 2. Quantitative analysis of residual indentation area in figure 1 (b). The residual area (shaded regions numbered 1 ~ 3) can be easily determined using Park Systems' data analysis software.
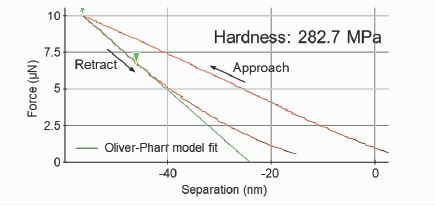
Figure 3. Example of a force-separation curve obtained on a SiOCH surface using nanoindentation technique. The Oliver-Pharr model was fit to the initial part of the retract curve to determine the sample hardness.
Some instrumental factors should be carefully considered to improve the accuracy of mechanical properties measured via AFM Nanoindentation including the calibration of the cantilever spring constant and the A-B sensitivity, the displacement measurement, and the tip shape characterization. For thin film samples, the indentation should not exceed 10 % of film thickness to reduce substrate effect. Also, relatively flat surfaces are recommended for Nanoindentation measurements. Besides the Berkovich tip, AFM Nanoindentation tips with different geometries (e.g., four-side pyramid, conical, and spherical) have been developed to improve the accuracy and efficiency of nanomechanical measurements. In addition to the conventional hardness evaluation via indentation area and applied force, the sample hardness and other mechanical properties can also be obtained from a force-separation curve collected during the Nanoindentation experiment (see “Force distance spectroscopy mode note” for more information about force-separation curve). In general, the force-separation curve obtained from Nanoindentation is similar to the curve measured in Force distance spectroscopy. However, Force distance spectroscopy typically targets soft samples with dominant elastic behavior, i.e., reversible deformation, whereas Nanoindentation is aimed at relatively hard samples with dominant elastic-plastic behavior, i.e., irreversible deformation.
Figure 3 shows an example of a forceseparation curve obtained using Nanoindentation. From this data, the mechanical properties of a sample can be determined using an appropriate contact model, which describes the contact geometry between the tip and the sample. Since Nanoindentation mode typically applies large forces to achieve a plastic deformation of the sample surface, the Oliver-Pharr model is well suitable to describe the nanomechanical sample behavior. The Oliver-Pharr model is based on the assumption that an elastic-plastic contact occurs as the tip approaches the sample surface and a purely elastic recovery takes place in the initial regime when the tip retracts from the sample surface. Hence, this model is generally used to fit the initial part of the retract curve to calculate mechanical properties such as hardness, stiffness, and Young’s modulus of the sample, as shown in figure 3. However, for the case of purely elastic contact between tip and sample, where approach and retract curves coincide, elastic contact models such as Hertz, Sneddon, JKR, or DMT models are recommended. By using the force-separation curve approach instead of the conventional hardness calculation method, it is possible to extract information about mechanical properties of the sample without measuring the residual indentation area and therefore, minimize uncertainties associated with small area measurements.