


Exploring Nanoscale Electrochemical Reactions with SECCM
Research Application Technology Center
Introduction
Interest in surface investigations and the study of chemical properties has been steadily increasing. In particular, electrochemical property research holds significance in various academic and industrial applications. These applications include the study of ion transfer distribu- tion across electrodes [1,2], the characterization of anode/cathode materials for battery design [3], the local electrochemical modification of substrates for surface enhancement [4], [5], the assessment of metal-oxide corrosion through electrochemically probing [6], [7] and the study of single-cell electrochemical activity [8]. While numerous measurement techniques have been reported, pipette-based scanning probe microscopy (SPM) methods offer novel insights when exploring chemical properties of nanoscale samples. The advent of scanning electrochemical microscopy (SECM) [9], one of the first-generation pipette-based SPM for electrochemical measurement, has greatly contributed to the visualization of chemical reactions at interfaces. However, SECM has, thus far, been constrained by limitations in distance control between probe and sample surface, and the necessity to immerse the sample in a liquid medium. In contrast, scanning electrochemical cell microscopy (SECCM) [10-14], utilizes an electrolyte filled nano-pipette to create a meniscus contact at the sample surface, thus forming an electrochemical cell at the tip of the pipette. Since its inception, SECCM has found utility in various research fields due to its ability to provide localized measurements at the nanometer scale, intuitive pipette control, and the capability to operate under ambient conditions.
In this application note, we provide an introduction to SECCM including its principles, set-up, and diverse applications. In addition, we explain the interpretation of the cyclic voltammetry (CV) curve, recorded by SECCM, and the CV mapping image for few layers graphene deposited on conductive substrates, we discuss how SECCM can be used in various fields.
SECCM set-up and electrochemical measurements
SECCM utilizes a glass pipette with an inner diameter in the range of hundreds of nanometers for interface measurements of local electrochemical properties. To prepare it, a glass pipette (G100F3, Warner Instruments, U.S.A.) with a 1 mm outer diameter (O.D.) and a 0.58 mm inner diameter (I.D.) were pulled using a commercial CO2 laser pipette puller (P2000, Sutter Instruments, U.S.A.) to fabricate approximately 200 ~ 350 nm I.D. nano-pipettes (Figure 1a). An Ag/AgCl electrode as a quasi-reference counter electrode (QRCE) is inserted in the pipette, the electrolyte solution (10 mM Ru(NH3)6Cl3 and 100 mM KCl) with the electrochemical species is filled in the pipette. A voltage is applied between the conductive substrate and the pipette electrode filled with the electrolyte solution (Figure 1b).
The approach of the probe uses the ionic current as distance control: the sharp increase in the ionic current that originates from the formation of the meniscus (electrochemical cell). The distance between the pipette end and the sample is determined by the meniscus that is formed between the two. The pipette with a hemisphere shaped bubble of solution at the end approaches toward the sample in a vertical direction. As soon as the meniscus is formed between the pipette end and the sample surface, a closed electrical circuit is created which causes a sharp ionic current spike. This spiky signal is used to halt the pipette’s approach and maintain a constant distance between the pipette and the sample [10], [12].
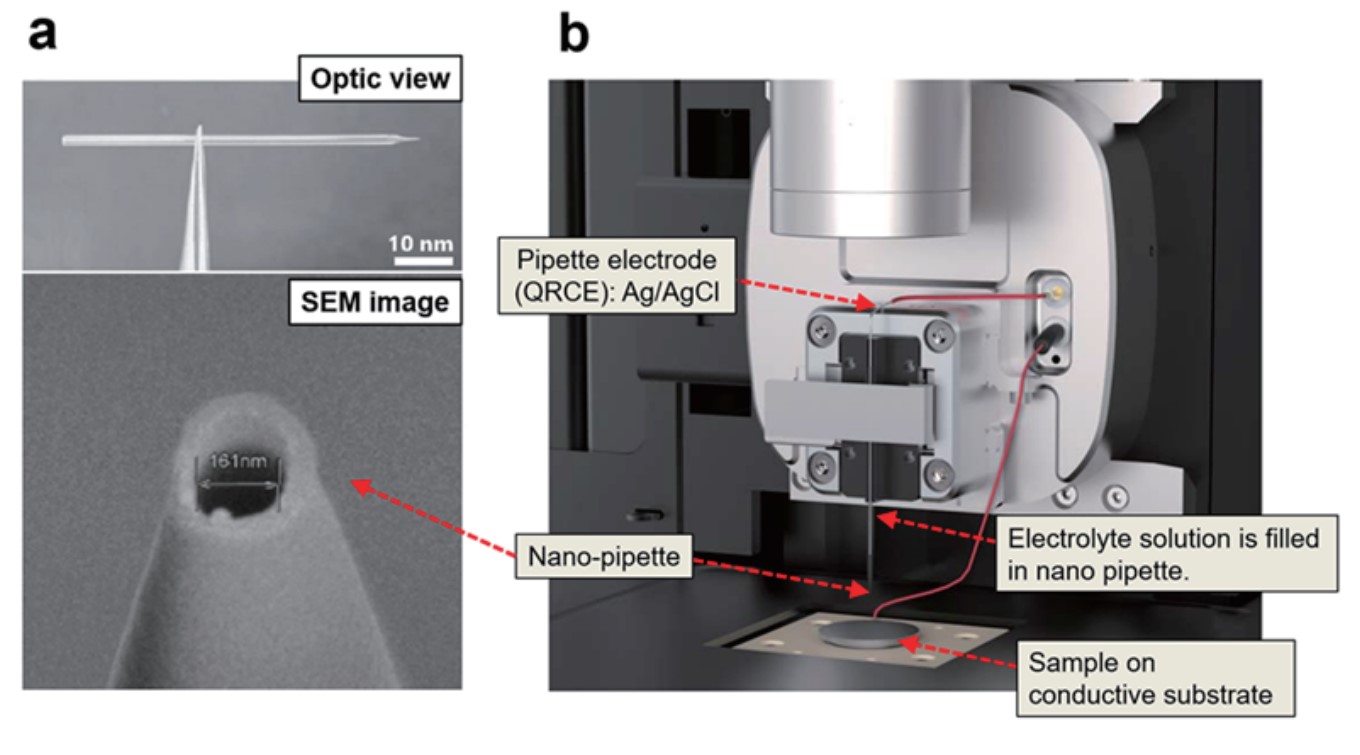
Figure 1. Images of pulled nano-pipette with ~161 nm I.D. (a) and Park systems’ SECCM set-up including parts description
To visualize the electrochemical signal, approach-retract scanning (ARS, also known as hopping mode) is utilized; this method involves the approach of the nano-pipette, followed by CV curve determination, retraction of the nano-pipette, and its lateral movement. At each point an independent CV curve is measured; CV mapping uses a series of predefined locations in a grid (Figure 2) to build its images.
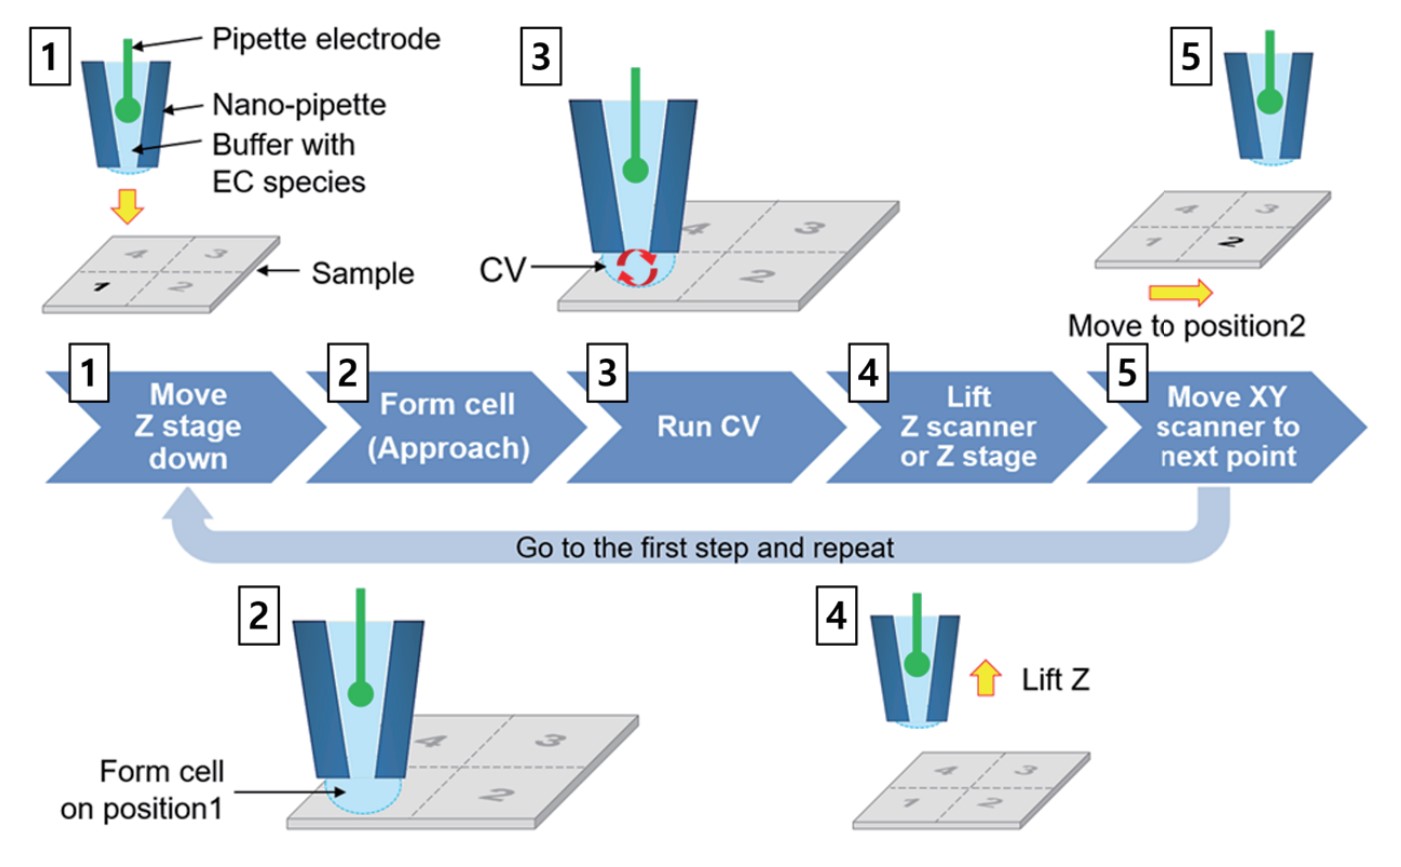
Figure 2. SECCM CV mapping process. The EC response contrast of the sample surface is displayed as an image with a cycle of repeated Approach-CV curve measurement-retract-lateral movement.
Cyclic voltammetry
CV is a widely used electrochemical technique that involves applying a varying potential to an electrochemical cell while measuring the resulting current. It provides information about the redox behavior and electrochemical properties of a system, such as the oxidation and reduction potentials, electron transfer kinetics, and diffusion coefficients of electroactive species [15].
In a typical CV experiment, a working electrode is immersed in an electrolyte solution and connected to a potentiostat, which applies a potential ramp to the working electrode. The potential is scanned linearly with respect to time, and the resulting faradaic current is measured. The potential ramp can be either positive or negative, and the direction of the scan is reversed periodically to create a "cyclic" pattern. The measured current is plotted against the applied potential to generate a cyclic voltammogram, which is a graphical representation of the electrochemical behavior of the system under study. The resulting voltammogram typically exhibits peaks or waves corresponding to the oxidation and reduction of electroactive species present in the electrolyte solution.
CV curves obtained in SECCM can exhibit a few types, each of which carries specific meanings and provides insights into the electrochemical behavior of the sample (CV curves on HOPG with 10 mM Ru(NH3)6Cl3 and 100 mM KCl were recorded).
Steady-state CV curve (Figure 3a): The current response at the working electrode stabilizes at a constant or near-constant value after several scan cycles. This indicates that the electrochemical system has reached a steady-state, where the rates of the oxidation and reduction reactions are balanced, and the current response has achieved a stable, reproducible behavior. Steady-state CV curve refer to a state where species concentrations remain constant over time at any point along a curve, and only vary with distance from the electrode.
Reversible (Quasi-Reversible) CV curve (Figure 3b): This type of CV curve typically exhibits well-defined anodic and cathodic peaks of equal height and shape, and the current response returns to the baseline between the peaks. This indicates a reversible or quasi-revers- ible redox process, where the electron transfer is rapid and the species undergoing oxidation and reduction have similar kinetics. Irreversible CV curve (Figure 3c): In this type of CV curve, the anodic and cathodic peaks are asymmetric. The current response does not return to the baseline between the peaks, where the electron transfer is slow or involves chemical reactions. The peak potentials can provide information about the redox potentials of the species, but the peak currents cannot accurately represent the species' concentration.
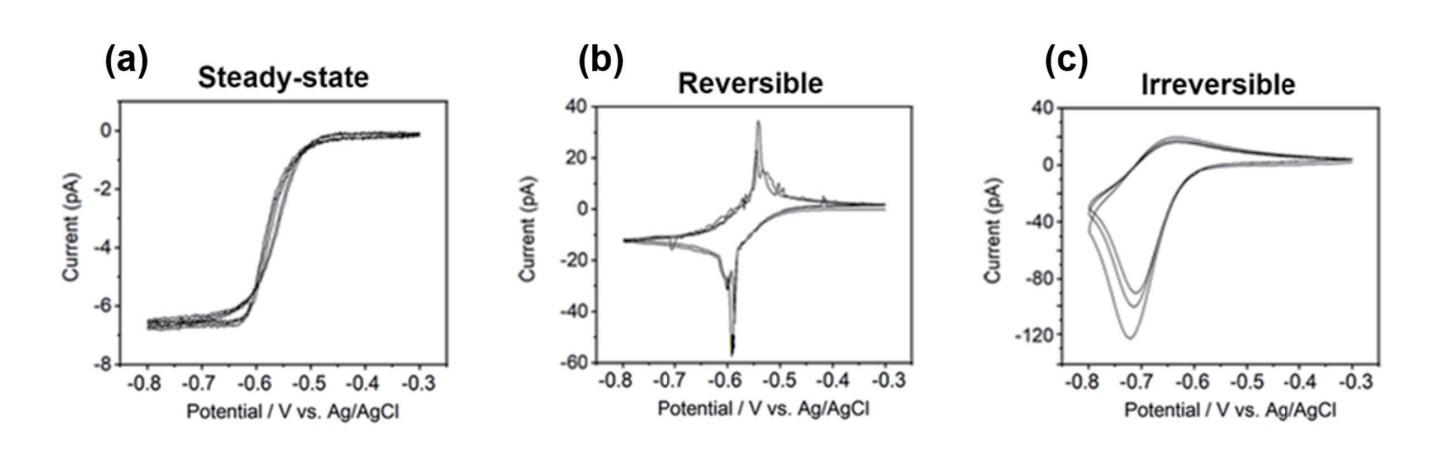
Figure 3. Types of CV curve, steady-state (a), reversible (b), and irreversible (c)
The voltage scan rate plays a crucial role in the shape and characteristics of the CV curve. Changes in the scan rate can result in changes in the shape, size, and peak potential of the CV curve. The scan rate affects the rate of electron transfer reactions that occur at the electrode surface. A higher scan rate typically leads to faster electron transfer kinetics, resulting in changes in the shape and magnitude of the CV curve. Figure 4 shows how the current signal was affected by the scan rate of the CV curves. To evaluate the effect of scan rate, CV curves on HOPG with 10 mM Ru(NH3)6Cl3 and 100 mM KCl and a ~340 nm I.D. nano-pipette were performed using a range of scan rates (0.1 to 10 V/s). As shown in Figure 4, the CV curve peak current (red arrow) increased as a function of scan rate. Theoretically, as the scan rate increases, the peak current increases, and the peak to peak of potential also increases [12], [16]. CV curve shapes looked similar at scan rates of less than 1 V/s; peak current values decreased slightly and ranged from -65 pA to -72 pA. In contrast, at scan rates above 1 V/s, especially from 3–10 V/s, the response began to show the peak expected for linear diffusion and the peak current increased to -130 pA. It is a somewhat peak-shaped CV curve but the current value at the switching potential and the small peak current ratio show that the steady-state component still dominates.
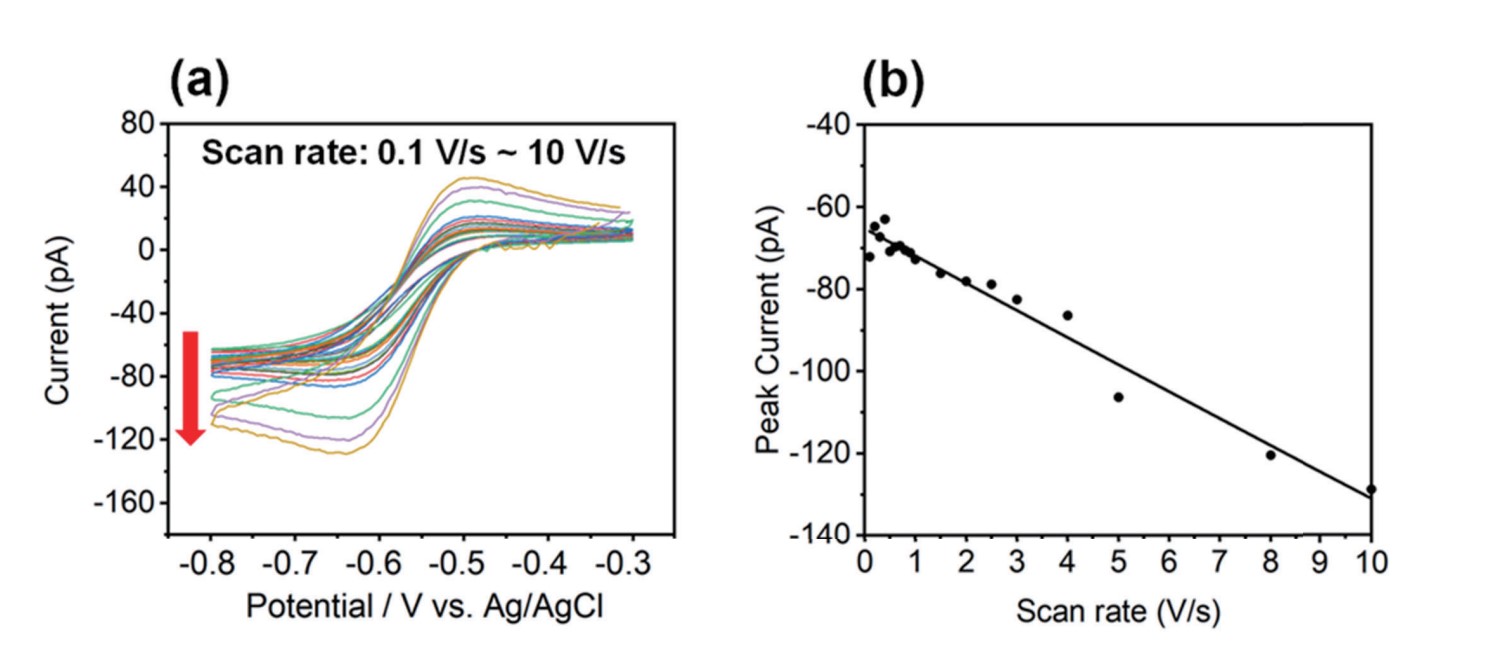
Figure 4. CV curves (a) and peak currents as a function of different scan rates (0.1 V/s ~ 10 V/s), (b). As the scan rate increases, the peak current also increases. It was performed using 340 nm of inner diameter nano-pipette with an aqueous solution containing 10 mMRu(NH3)6Cl3 and 100 mM KCl on HOPG.
Next, we obtained AFM images to determine surface morphologies and CV mapping to estimate EC signal contrasts on few layers graphene deposited on an indium tin oxide (ITO) substrate. All CV mapping images were obtained using a ~340 nm I.D. nano-pipette, 10 mM Ru(NH3)6Cl3, 100 mM KCl supporting electrolyte and a 1 V/s scan rate. Using confined meniscus contact, nano-scale imaging can distinguish the EC signal of the graphene basal plane, multi-layered graphene, and graphene with a conductive substrate. Heights from 50 to 100 nm were found at graphene multi-layers by AFM and a significantly clear EC signal contrast was recognized by CV mapping. Higher EC response can be attributed to the ITO substrate so that graphene flakes showed lower EC currents as compared to the ITO substrate.
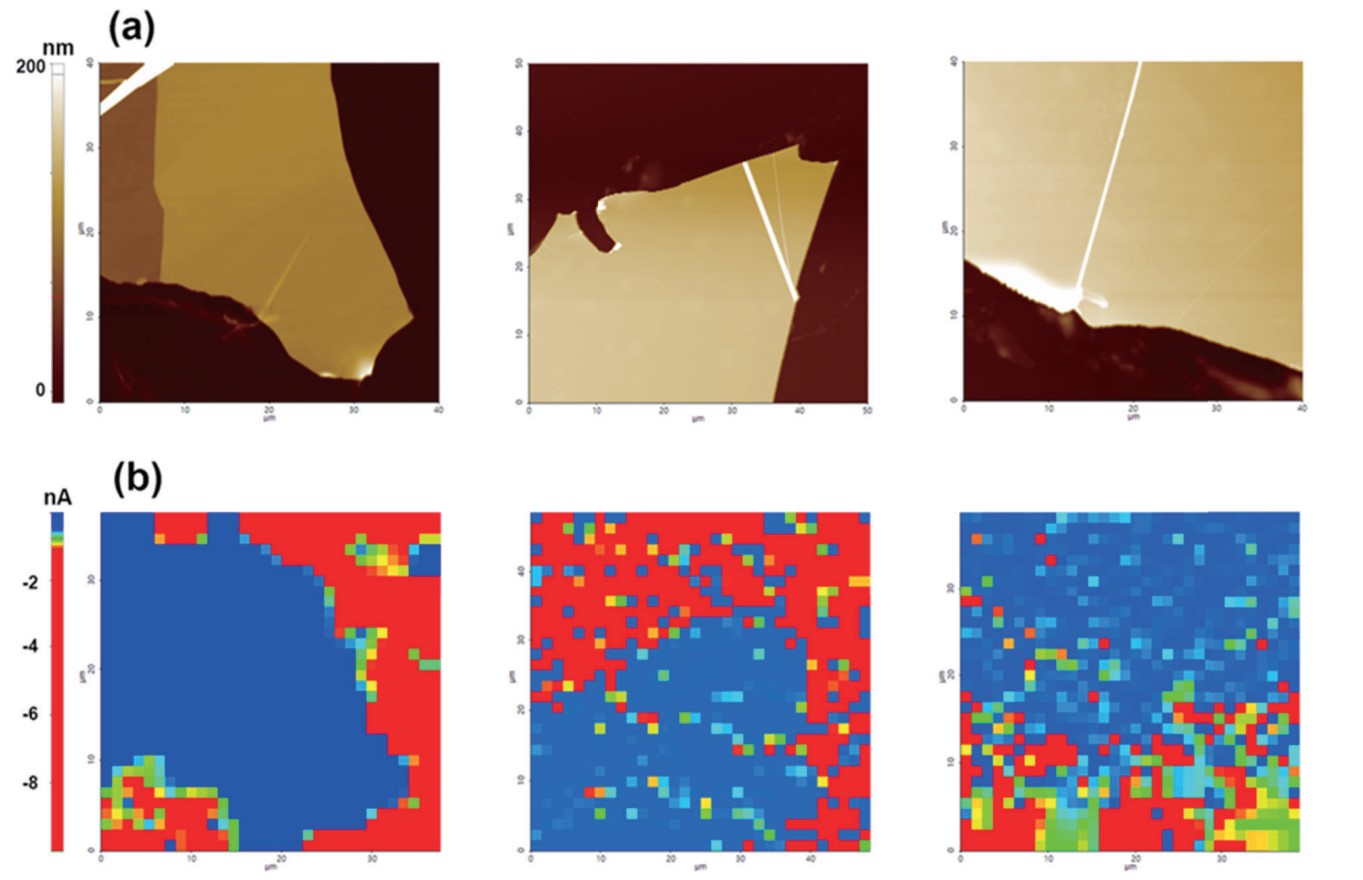
Figure. 5 AFM height images (a) and CV mapping images on graphene flakes on an ITO substrate sample (b). Different EC response on graphene flake and ITO substrate was clearly confirmed on CV mapping image. Each CV curve was performed using ~340 nm of I.D. nano-pipette with an aqueous solution containing 10 mM Ru(NH3)6Cl3 and 100 mM KCl, and the scan rate was 1 V/s.
Conclusions
Through the above results, Park Systems’ SECCM successfully measured what level of faradaic current signal and how accurate the potential reading was in the data set we presented here. It is worth to note that the potential reading is critical in electrochemistry because it decides how efficient a reaction can be in the realm of practical applications such as developing catalyst, even for fundamental research.
SECCM is a powerful technique for studying local electrochemical properties at the nanoscale using pipette-based scanning electrochemical microscopy. SECCM offers advantages such as intuitive pipette control, ambient condition measurement, and the ability to perform local measurements with high spatial resolution. Through the interpretation of CV curves and CV mapping images, SECCM can provide valuable insights into the electrochemical behavior of samples. SECCM has been widely used in various research fields, including the study of ion transfer distribution, battery materials, surface modification, metal-oxide corrosion, and single-cell electrochemical activity. With its unique capabilities, SECCM continues to contribute to the growing interest in surface investigations and chemical properties, opening up new possibilities for nanoscale electrochemical research.
References
1. Patten, H. V., Lai, S. C. S., MacPherson, J. V. & Unwin, P. R. Active sites for outer-sphere, inner-sphere, and complex multistage electrochemical reactions at polycrystalline boron-doped diamond electrodes (pBDD) revealed with scanning electrochemical cell microscopy (SECCM). Anal. Chem. 84, 5427–5432 (2012).
2. G. Güell, A., Ebejer, N., E. Snowden, M., V. Macpherson, J. & R. Unwin, P. Structural Correlations in Heterogeneous Electron Transfer at Monolayer and Multilayer Graphene Electrodes. J. Am. Chem. Soc. 134, 7258–7261 (2012).
3. Ruffo, R., Wessells, C., Huggins, R. A. & Cui, Y. Electrochemical behavior of LiCoO2 as aqueous lithium-ion battery electrodes. Electrochem. commun. 11, 247–249 (2009).
4. Kooi, S. E., Schlecht, U., Burghard, M. & Kern, K. Electrochemical modification of single carbon nanotubes. Angew. Chemie - Int. Ed. 41, 1353–1355 (2002).
5. G. Williams, C., A. Edwards, M., L. Colley, A., V. Macpherson, J. & R. Unwin, P. Scanning Micropipet Contact Method for High-Resolution Imaging of Electrode Surface Redox Activity. Anal. Chem. 81, 2486–2495 (2009).
6. Leidheiser, H. Electrical and Electrochemical Measurements As Predictors of Corrosion At the Metal-Organic Coating Interface. Prog. Org. Coatings 7, 79–104 (1979).
7. Suter, T. & Böhni, H. Microelectrodes for studies of localized corrosion processes. Electrochim. Acta 43, 2843–2849 (1998).
8. Pan, R., Xu, M., Jiang, D., Burgess, J. D. & Chen, H. Y. Nanokit for single-cell electrochemical analyses. Proc. Natl. Acad. Sci. U. S. A. 113, 11436–11440 (2016).
9. Bard, A. J., Fan, F. F., Kwak, J. & Lev, O. Scanning Electrochemical Microscopy. Introduction and Principles. 61, 132–138 (1989).
10. Ebejer, N., Schnippering, M., Colburn, A. W., Edwards, M. A. & Unwin, P. R. Localized high resolution electrochemistry and multifunctional imaging: Scanning electrochemical cell microscopy. Anal. Chem. 82, 9141–9145 (2010).
11. Snowden, M. E. et al. Scanning electrochemical cell microscopy: Theory and experiment for quantitative high resolution spatially-resolved voltammetry and simultaneous ion-conductance measurements. Anal. Chem. 84, 2483–2491 (2012).
12. Ebejer, N. et al. Scanning Electrochemical Cell Microscopy: A Versatile Technique for Nanoscale Electrochemistry and Functional Imaging. Annu. Rev. Anal. Chem. 6, 329–351 (2013).
13. Bentley, C. L., Kang, M. & Unwin, P. R. Scanning electrochemical cell microscopy: New perspectives on electrode processes in action.
Current Opinion in Electrochemistry vol. 6 23–30 (2017).
14. Daviddi, E., Gonos, K. L., Colburn, A. W., Bentley, C. L. & Unwin, P. R. Scanning Electrochemical Cell Microscopy (SECCM) Chronopotentiometry: Development and Applications in Electroanalysis and Electrocatalysis. Anal. Chem. 91, 9229–9237 (2019).
15. Costentin, C., Fortage, J. & Collomb, M.-N. Electrophotocatalysis: Cyclic Voltammetry as an Analytical Tool. J. Phys. Chem. Lett. 11, 6097–6104 (2020).
16. Zhang, G., Cuharuc, A. S., Güell, A. G. & Unwin, P. R. Electrochemistry at highly oriented pyrolytic graphite (HOPG): lower limit for the kinetics of outer-sphere redox processes and general implications for electron transfer models.
Phys. Chem. Chem. Phys. 17, 11827–11838 (2015).